Download
1 / 47
490 likes | 649 Vues
Learn about survey designs and sampling methods to assess the impact on food and nutrition in crisis situations. Understand the checklist for survey planning and calculation techniques for systematic and cluster sampling.

E N D
Food and Nutrition Surveillance and Response in Emergencies Session 12 Data Collection, Analysis and Interpretation
Introduction • Assessing the impact on food and nutrition and understanding the coping mechanisms of different affected groups is needed to: • Target • design and • implement appropriate strategies To protect and promote good nutrition and household food security throughout relief and rehabilitation responses.
Introduction • Population in crisis may be moving or living in camps, towns or villages or dispersed in the rural environment • Design of the assessment depends mainly on the practical crisis conditions
Typical survey designs include: • Longitudinal survey: data is collected for the same population over a long period of time. Longitudinal studies are useful in establishing trends over a long period of time • Cross-sectional surveys: This is one of the commonly used survey designs that looks into population issues at a given point in time. • In emergency: Cross-sectional surveys mainly used.
Survey Planning • Collect the following information, if available, before the rapid assessment • Previous nutrition surveys • Demographic information • Mortality and morbidity • Socio-economic situation • Administrative structure
Survey Planning • CHECKLIST FOR PLANNING SURVEY • Which population is to be assessed • What is the smallest unit to be assessed (camp, village, district) • Which sampling methods will be used (systematic, cluster) • Which age group • Which indicators will be used (Weight for Height, oedema) • What personnel, equipment, transport, number of teams and resources will be needed • How many clusters/children per day per team
Sampling methods in Emergency • Simple Random Sampling • Systematic Random Sampling • Cluster Sampling
Simple Random Sampling • The survey subjects are chosen at random from a list of all those eligible in the sampling population. • This is the ideal procedure but not practicable in emergency situation
Systematic Random Sampling • Survey subjects are selected systematically e.g. every 10th child from a list of all households. If the average number of preschool children is known, a sample of every 10th house or tent may be taken systematically and all eligible children examined • Sample size for systematic random sampling is 450 children
Systematic Random Sampling Recommended where: • the population is concentrated in an organised or structured urban setting or in refugee camp. • The total number of households is less than 10,000
Systematic Random Sampling Information required for this sampling method: • Total number of households. • Total population • Average number of children 6 months to 5 years age (100 cm) bracket per household • In camps and permanent settlements, the sampling unit – household or dwelling (tent)
Systematic Random Sampling Calculation of the number of households to obtain the required number of eligible children No. of Households = 450/ (A x P) where: A= Average household size P= Proportion of children right age/height
Systematic Random Sampling No. of Households to be visited Example: If average hh size is 6 persons and the percentage of children under 5 years is 15% (0.15) 450 / ( 6 x 0.15) = 500 households
Systematic Random Sampling No. of Households to be visited Example: If the sampling area consists of 9000 household the sampling interval is: 9000/ 500 = 18. Visit every 18th household
Cluster Sampling • Sampling method used for large populations and populations spread over large area for which estimates of the number of people are available. • It may also be useful in large or newly established camps where numbers and ages of people are not fully known • The sample size needed to obtain the same precision is about twice that of the systematic random sample = 900 children
Cluster Sampling • To obtain 900 children, the sample size for cluster sampling is 30 clusters of 30 children. • The sampling method is referred to as 30 by 30 cluster method • For reliability of results, it is important to examine not less than 30 clusters and not less than a total of 900 children.
Cluster Sampling Sampling procedure: • Map out area of study following existing geographic or administrative boundaries • Obtain best available census data for each division/location • Prepare a list with three columns: Column 1: Name of each geographic unit ( e.g. District, Division, Location.
Cluster Sampling • Column 2: Population of each unit, • Column 3: cumulative population of the units. • Each unit should have at least 300 inhabitants • Draw a systematic sample of 30 clusters from the list and their population estimates
Cluster Sampling • Obtain sampling interval by dividing the total population by number of clusters-usually 30 • Example: Suppose there is a total of 183 sections, the sampling interval = 183/30=6.1 • Every 6th section/unit is then drawn randomly until 30 survey sections – the clusters - are selected • The 30 children are obtained from these 30 clusters
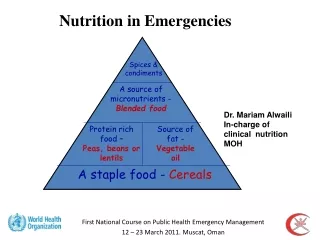
Design of Survey Tools Main Indicator • Weight for height is recommended as the main indicator of malnutrition by most guidelines • Independent of age • Has internationally accepted reference population • Interpretation based on wide experiences from many parts of the world.
Design of Survey Tools Questionnaire Design Consideration: • Surveys are two communication: AUDIENCE + PURPOSE=DESIGN • Respondents prefer shorter surveys • Keep questions clear and concise • Contents should not be controversial or sensitive
Rapid Assessment Mainly carried out on adhoc bases. Useful when: • When nutrition information are fast needed • When resources of carrying out Nutrition survey are limited. • MUAC is usually used • Additional methods include: FGD, Key informant interview, observation (transect walks), seasonal calendars and Case study.
Type of information in RA • MUAC measurements: adults (women), <5yr • Food availability and accessibility • Water sources • Common diseases- how are recent trends • Access to health services/ other interventions • Livestock and population movement- destinations/ origin of emigrants • Type of food consumed/freq. of feeding • Security situation
What is Data analysis? • The way information and results are interpreted and assessed • Assigning meaning to figures, stories, observations, etc that have been gathered and recorded. • Conceptual frameworks (i.e., UNICEF) guide data analysis. • Data analysis possible by hand or computer (various packages, e.g., EPINFO; EPINUT; SPSS; etc.)
Handling data before analysis … • Clearly identify source (by name or code) • Keep track of those who have not responded and follow up • Indicate the date and file data securely • Review responses for completeness • Translate into code (if necessary) or summarise using key words • Decide on how to record missing data • Transfer data to blank copies of the original monitoring sheet or a spreadsheet programme in preparation for analysis.
Types of Data • Numerical: values for which a numeric magnitude has meaning • discreet • Restricted to certain values that differ in fixed amounts. No intermediate values are possible, i.e., number of times a woman has given birth or number of beds available in a hospital • Continuous • Not restricted to whole number values, i.e., height, weight • Non-numerical: values for which magnitude has no meaning. • Nominal/categorical class • Values are arbitrary codes with no inherent meaning. The order and magnitude are unimportant, i.e., sex (1=male, 2=female) • Ordinal • Values have inherent meaning based on order but not magnitude, i.e., ratings of quality (1=high, 2=low or 2=high, 1=low)
Steps in data analysis and interpretation • Review the questions that generated the information. • Why was the particular information necessary? What kind of decisions are to be made based on this information? • Collate the relevant data: • Baseline info and previous surveys or assessments undertaken • Background info e.g. morbidity data, food security info, health facilities data, ongoing interventions, security situation. • Sort information into parts that belong together.
Steps in data analysis and interpretation continued … • Data preparation and cleaning • Before starting the analysis, the data needs to be prepared and “cleaned”. Issues to look out for include:- • Missing data • Data out of the required range. • Extreme (biologically unlikely) weight for height data – outliers • Analyze qualitative data • Analyze quantitative data • Integrate the information
Analysing Qualitative Data • Describe the phenomena • transcribe all interviews/observations • thorough and comprehensive (‘thick’ description), i.e., information about the context of an act, the intentions of the actor and the process in which action is embedded. • describe the sample population, • who were the key informants, what made them qualify as such? Who took part in the FGDs? How representative were the participants of the groups they represented? Under what circumstances were observations carried out? Who was observed (and who was not)? • Classification of the data • look for and code key words and phrases that are similar in meaning • categorize issues by topics • Identify and group (categorise) pieces of data together, i.e., separate similar or related data
AnalysingQualitative Datacontinued ... • Interconnect the concepts • compare responses from different groups • determine patterns and trends in the responses from different groups or individual respondents • make summary statements of the patterns or trends and responses • cite key quotations, statements and phrases from respondents to give added meaning to the text. • re-check with key informants to verify the responses and the generalization of the findings. • Display summaries of data in such a way that interpretation becomes easy, • list the data that belong together – may be followed by further summarization graphically in some chart (i.e., a matrix – most common form of graphic display of qualitative data) or a figure (i.e., diagram, flow chart). These help visualize possible relationships between certain variables.
AnalysingQualitative Datacontinued ... • draw conclusions, and (remember…) • collection, processing, analysis and reporting of qualitative data are closely intertwined, and not (as is the case with quantitative data) distinct successive steps. One searches for evidence, purposively looks for associations during the fieldwork by intertwining data collection and analysis, verifies findings by looking for independent supporting evidence. • develop strategies for testing or confirming findings to prove their validity. • Check for representativeness of data (since informants are selected systematically & according to previously established rules) --- are all categories of informants been interviewed? Cross-check data with evidence from other, independent sources (informants, informant categories or different research techniques)
Analysing quantitative data • First thing to do to analyse quantitative data is convert raw data into useful summaries • Descriptive measures • Proportions, frequencies and ratios • Measures of central tendency • Mean/average, median, mode • Measures of dispersion • Range, standard deviation, percentiles.
Measures of Central Tendency • A fundamental task in many statistical analyses is to estimate a location parameter for the distribution; i.e., to find a typical or central value that best describes the data. • Interval estimates • Parameter estimated from a sample data (point estimate or sample estimate) as opposed to population (true value) parameter. • Mean – the true mean is the sum of all the members of the given population divided by the number of members in the population. Impractical to measure every member a random sample is drawn gives the point estimate of the population mean. • Interval estimate expand on point estimates by incorporating the uncertainty of the point estimate. • For example, different samples from the same population will generate different values for the sample mean. • An interval estimate quantifies this uncertainty in the sample estimate by computing lower and upper values of an interval which will, with a given level of confidence (i.e., probability) contain the population parameter.
Measures of central tendency continued… • Why different measures • Normal distribution • Symmetric distribution – single peak, well-behaved tails • (estimates for mean, median & mode similar) - use mean as the locator estimate. • Exponential distribution • Skewed distribution – mean & median not the same – mean pulled to one side (direction of skewness). Use all three central measures. • Cauchy distribution • Symmetric distribution – single peak with heavy tails • extreme values in the tails distort the mean - use median as the locator estimate.
Quantitative techniques continued… • Hypothesis test • Also addresses the uncertainty of the sample estimate. However, instead of providing an interval, a hypothesis test attempts to refute a specific claim about a population parameter based on the sample data. • To reject a hypothesis is to conclude that it is false. • To accept a hypothesis does not mean that it is true, only that we not have evidence to believe otherwise. • Hypothesis tests are usually stated in terms of both a condition that is doubted (null hypothesis) and a condition that is believed (alternative hypothesis).
Quantitative techniques continued… • Common format for a hypothesis test: • H0:a statement of the null hypothesis, e.g., two population means are equal. • Ha: a statement of the alternative hypothesis, e.g., two population means are not equal. • Test statistic: the test statistic is based on the specific hypothesis test. • Significance level: the significance level, α, defines the sensitivity of the test (i.e., 0.1, 0.05, 0.001) and denotes that we inadvertently reject the null hypothesis by that percentage (i.e., 10,5 or 1%) of the time when it is in fact true. The probability of rejecting the null hypothesis when it is in fact false is called the power of the test and is denoted by 1-ß. Its compliment, the probability of accepting the null hypothesis when the alternative hypothesis is, in fact, true is called ß, and can only be computed for a specific alternative hypothesis.
Quantitative techniques continued… • Two-sample t-test for Equal Means • Used to determine if two population means are equal, i.e., tests if a new process or treatment is superior to a current process or treatment. • Data may either be paired or not paired. • One-factor ANOVA • One factor analysis of variance is a special case of ANOVA for one factor of interest and a generalization of the two-sample t-test. • Multi-factor ANOVA • Used to detect significant factors in a multi-factor model. A response (dependent) variable and one or more factor (independent) variables as is the case in designed experiments where the experimenter sets the values for each of the factor variables and then measures the response variable.
Data interpretation • Summaries of data interpretation of results. • What tools are used for interpretation? • Logic • Knowledge of the programme • Experience. • Ascription • Pre- and post-measures of change. • After-the-fact statements of change • Explicit statements of cause/motivation of change • Evidence ruling out plausible alternative explanation for the change • Independence evidence attesting to the program’s likelihood of effecting change.
Data interpretationcontinued… • Assessment • Comparison with past project performance • Comparison with accepted target levels • Comparison with other programmes or general norms • Comparison with constituents needs • With some standards, cost-benefit comparison
Data interpretationcontinued… • Description of the sample • Describe the study population by producing tables showing the distribution of important variables e.g. sex, age, sex by age, morbidity, nutritional status, nutritional status and age, nutritional status and sex, nutritional status and morbidity, etc. • Establish the links and association among the various variables and the nutritional status • Statistical analysis could be used to determine links or associations between various quantitative data. • Further links between qualitative data and the resulting nutritional status could be established guided by the conceptual framework.
Data interpretationcontinued… • Variables to look into in establishing associations/links:- • Socio-economic and political environment • Food security situation (food availability and access) • Health and sanitation • Care practices for mothers and children • Food consumption • Food utilization by the body • Mortality
Data interpretationcontinued… • Identify areas requiring interventions • Are the interventions that contribute positively to nutritional status available and accessible to all or sustainable? • Identify factors contributing negatively to nutritional status. Have these been sufficiently addressed? • Compare the current, nutrition situation and the previous rates. Is it acceptable, poor, serious or critical (WHO classification)? • Prepare study findings or results • Prepare study results highlighting the key findings • Discuss study findings with study population and partners • Provides an opportunity for further comprehensive discussion and analysis of the results especially with the study population.
% median and Z scores • Percentage of Median – the ratio of a child’s weight to the median weight of a child of the same height in the reference data, expressed as a percentage, e.g., if the median weight of the reference data for a particular height is 10kgs then to say that the child is 80% weight for height means that the child is 8kgs. WFH Percent median = Individual weight x 100 Median reference weight • Z-scores: by describing how far in units (units called SD’s) a child’s weight is from the median weight of a child at the same height in the reference data. The “distance” is called a Z-score. It is expressed in multiples of the standard deviation and is derived as follows: WFH Z-score = Observed weight – median weight Standard Deviation
WHO Classification of Global Acute Malnutrition Using Z- Scores
Quality control measures • Thorough training of staff plus pre-testing of tools (interpretation of the questionnaires, if necessary) • Standardization tests- Intra-personal/ interpersonal errors • Close monitoring of the field work by qualified persons • Cross-checking of the field questionnaires for anomaly daily • Daily review of enumerator experiences and problems • Progress review per plan and by checklist • Data cleaning: collection, entry, • Integrity of equipments: maintain accuracy using known weights