Download
1 / 33
330 likes | 401 Vues
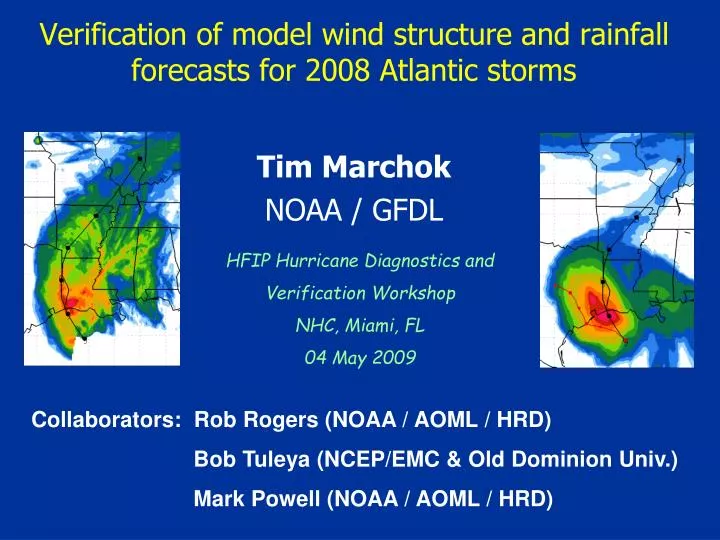
This workshop-focused study discusses the validation techniques for 2008 Atlantic storm forecasts, emphasizing rainfall patterns, volume, and extreme amounts, along with model wind structure evaluations. The importance of near-surface wind structure and clustering methods is highlighted. Skill indices, pattern matching assessments, and storm attributes are examined, addressing TC rainfall uniqueness. The comparative analysis indicates that GFS model demonstrates superior skillfulness in both 2005 and 2008 samples, despite varying resolutions among models. The study delves into storm Destructive Potential metrics, radial profiles, and wind distribution for a comprehensive verification approach.

E N D
Verification of model wind structure and rainfall forecasts for 2008 Atlantic storms HFIP Hurricane Diagnostics and Verification Workshop NHC, Miami, FL 04 May 2009 Tim Marchok NOAA / GFDL Collaborators: Rob Rogers (NOAA / AOML / HRD) Bob Tuleya (NCEP/EMC & Old Dominion Univ.) Mark Powell (NOAA / AOML / HRD)
Motivation • Inland flooding from TC rainfall accounts for a significant percentage of deaths from U.S. landfalling TCs. • Storm size / structure has a major impact on the amount of damage at landfall. …both aspects have only recently begun to receive attention in terms of model evaluation
Outline • Rainfall validation & techniques • Application of TC QPF validation techniques to 2008 U.S. landfalling storms • Development of model wind structure validation techniques • Application of wind structure validation techniques to 2008 Atlantic TCs
Rainfall validation: What to focus on? • Rainfall patterns • Rainfall mean & volume • Extreme amounts
Example: Hurricane Gustav 72-h total rainfall HWRF GFDL Stage IV NAM GFS R-CLIPER
Rainfall Patterns Equitable Threat Scores 2008 2005 Pattern Correlations: GFS (r = 0.78) HWRF (r = 0.60) GFDL (r = 0.53) NAM (r = 0.52) R-CLIPER (r = 0.51) (2008)
Rainfall volume Comparison of rain volume bias by model 2005 2008
2008 Landfalling Storms 50% level Difference between obs rain value and fcst rain value at 50% level determines index
Rain volume: Rain flux in select bands GFS, NAM GFDL, HWRF 0–100 km 300-400 km
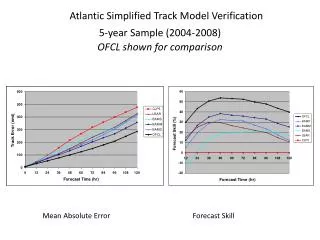
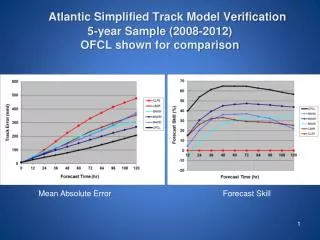
Skill Indices: Pattern Matching 2008 2005 • GFS performs the best in both samples • All models have skill relative to R-CLIPER
Skill Indices: Mean / Volume 2008 2005
Skill Indices: Extreme Amounts 2005 2008 • GFDL overforecasts the large amounts, HWRF underforecasts them, resulting in comparable indices • GFS performs best despite lowest resolution
Rainfall Summary • Validation techniques address unique TC rainfall attributes: • Pattern matching • Rainfall volume • Extreme amounts • TC QPF skill indices for operational forecast evaluation • GFS most skillful in 2008 (similar to 2005)
Outline • Rainfall validation & techniques • Application of TC QPF validation techniques to 2008 U.S. landfalling storms • Development of model wind structure validation techniques • Application of wind structure validation techniques to 2008 Atlantic TCs
The importance of near-surface wind structure Area_TSKatrina = Factor of 9 Area_TSCharley
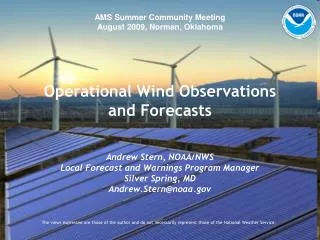
Focus is on continuous / homogeneous methods • Distribution of Winds • Fractional areal coverage • PDFs of the winds • Radial Structure • Earth-relative profiles • Storm motion-relative profiles • Radius of max winds • Storm Destructive Potential • IKE, SDP, WDP (Powell and Reinhold 2007) • Others?
Distribution: Fractional Areal Coverage (34-kt winds) NW NE Storm- sample average at tau=00h SW SE
Distribution: Fractional Areal Coverage (34-kt winds) NW NE Storm- sample average at tau=48h SW SE
Distribution: Fractional Areal Coverage (64-kt winds) NW NE Storm- sample average at tau=00h SW SE
Distribution: Fractional Areal Coverage (64-kt winds) NW NE Storm- sample average at tau=48h SW SE
Radial profiles of the wind (all cases) NW NE Tau= 00h SW SE
Radial profiles of the wind (all cases) NW NE Tau= 48h SW SE
Radial profiles of the wind (Hurricanes only) NW NE Tau= 00h SW SE
Radial profiles of the wind (Hurricanes only) NW NE Tau= 48h SW SE
Forecasts of Integrated Kinetic Energy GFDL Ike Intensity Forecasts HWRF Ike Intensity Forecasts Max Wind (kts) Max Wind (kts) GFDL Ike IKE (V>18 m/s) Forecasts HWRF Ike IKE (V>18 m/s) Forecasts IKE (TJ) IKE (TJ)
Wind Structure Summary • Methods complementary to wind radii validation • Focus on various aspects of wind field • Distribution • Radial structure • IKE / Storm destructive potential • Others…? • Some biases already evident