Download
1 / 72
720 likes | 841 Vues
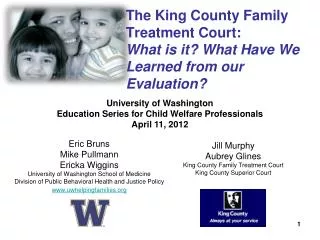
Eric Bruns Mike Pullmann Ericka Wiggins University of Washington School of Medicine Division of Public Behavioral Health and Justice Policy www.uwhelpingfamilies.org. The King County Family Treatment Court: What is it? What Have We Learned from our Evaluation?.

E N D
Eric Bruns Mike Pullmann Ericka Wiggins University of Washington School of Medicine Division of Public Behavioral Health and Justice Policy www.uwhelpingfamilies.org The King County Family Treatment Court:What is it? What Have We Learned from our Evaluation? University of WashingtonEducation Series for Child Welfare Professionals April 11, 2012 Jill Murphy Aubrey Glines King County Family Treatment Court King County Superior Court 1
Substance Abuse and Child Welfare • 80% of children in foster care have a parent with a substance abuse problem • Parents with substance problems have the lowest rate of reunification with their children • Their children stay in foster care over twice as long on average • Initiation of treatment takes an average of 4-6 months after entry to CW system
The need for a solution • Treatment completion is associated with: • Less time in foster care • Reunification rates • More rapid treatment entry and longer treatment duration is associated with: • Treatment completion • Treatment success • Less time in foster care • Reunification rates
Drug Courts • Interdisciplinary, coordinated, team-based approach to avoiding future involvement in (criminal) justice system • As of 2010: 2,459 drug courts in U.S. • Number increased by 50% from 2004 – 2010 • Seven meta-analyses • Rigor of studies often lacking; however, positive effects found • Positive treatment outcomes • Reduced re-arrest
Family Treatment Drug Courts • Apply drug court approach to cases of child abuse and neglect • Goal = enhance possibility of family reunification within legal timeframes by: • Facilitating entry and completion of treatment • Supporting parent to remain abstinent • Improving child safety/family functioning • As of 2009, NADCP reports 322 FTDCs • 13% of all drug courts in U.S. • Increase of 66% from 2005
Today’s presentation • The King County Family Treatment Court • Goals • Population of focus • Program description • Case flow process • What we have learned from an evaluation • Process evaluation • Outcome evaluation
The King County Family Treatment Court Jill Murphy KCFTC Program Supervisor Aubrey Glines KCFTC Graduate
KCTV Video • http://youtu.be/XU1gSDyTBxw
King County FTC Primary Goals Children have safe and permanent homes within permanency planning guidelines; Families of color have outcomes from dependency cases similar to families not of color; Parents are better able to care for themselves and their children and seek resources to do so; and The cost to society of dependency cases involving substances is reduced. 9
The King County Family Treatment Court • KCFTC PROCESSES AND FUNCTIONS • Comprehensive SB Assessment • High quality, appropriate CD Services • Timely/effective MH and other services • Effective care planning and management • Expanded and more frequent visitation • Consistent, timely incentives & sanctions • Random UA Screens • Effective pre-hearing case conferences • Effective judicial interaction • SHORT-TERM OUTCOMES • Eligibility/enrollment completed quickly • Enrollment in appropriate CD services • Parents compliant with/complete treatment • Parents ultimately able to remain sober • Parents/children more fully engaged in svcs • Parents/children receive needed services • Decreased placement disruptions • Parents compliant with court orders • Less negative effect on child well-being • Less disruption of child-parent bonds • Increased family reunification rates • Earlier determination. of alternate placement options • NATIONAL BEST PRACTICES • Communication bw Court and providers • Judge plays active role in Tx process • Judge responds to positive & noncompliant beh. • Mechanisms for shared decision making • Accountability for Tx services • Strategy for responding to noncompliance • MIS allow data to be assembled/reviewed • Enhancement of due process • Team members provided adeq resources 10
Population Focus Up to 60 children at a time, whose parent(s): • Admit to the court that his/her child is dependent or have an existing dependency finding • Are chemically dependent and willing to go to treatment; • Are at least 18 years of age; • Sign a Consent to Release Confidential Information Form so that the team may share information with other team members and outside community providers; • Have no felony child abuse or sexual abuse guilty findings; and • Applications/referrals to FTC must be received no later than six months from the date of dependency petition.
KCFTC Program Model • Parents agree to enter a more intensive court process • Expectation = 12 mos – 2 years duration • Case management to ensure connection to appropriate chemical dependency treatment • Cross-disciplinary pre-hearing staffings to present a unified approach at hearings • Case review hearings every other week until frequency can be stepped down • Treatment Liaison who monitors parent’s progress in CD and MH treatment and provides case management • Formal Wraparound Process for approx 1/3 of families (15 at a time) • Social Workers dedicated to the FTC with reduced caseloads (12:1)
Judge Assistant Attorney General Parent’s Defense Attorney Child’s Attorney Treatment specialist/ Treatment liaison Treatment provider Court Appointed Special Advocate (CASA) Wraparound coordinator DCFS Social Workers FTC Program Supervisor FTC Program Court Specialist Family members/friends Family support providers KCFTC Team Members
Petition Exit System Dismissed Petition Petition Petition Petition Petition Dismissed Dismissed Dismissed Dismissed Dismissed Enter FTC* (See separate flow chart) Shelter Care 30 - Day Shelter Pre - Trial Fact - Finding Disposition Shelter Care Hearing Placement in Dependency Case Conf . Care Review Conference Hearing Petition Hearing ( w / in 72 hours of place - Shelter Care Petition Filed Approved ( w / in 30 days of ment or filing , whichever ( 30 days prior to ( 21 days prior to ( w / in 75 days ( same day as or w / in 14 occurs first ) placement ) fact - finding ) of filing ) days of dep finding ) fact - finding ) Dependency Stipulated Dept . Review Hearing Child supervision ( the sooner of 90 days returned continues for from Dispo . or 6 mos . Exit FTC w/o Permanency Goal Achieved home from date of placement ) 6 mos . Dependency Continued Review *There can be entry into FTC anytime after dependency is established as long as a referral is made to FTC within 6 months of the filed petition date. Permanency Hearing Planning Hearing ( 12 months from date of placement & every 12 months thereafter ) Permanency Yes Goal Achieved ? No Petition for Yes Parental Rights Termination ? No Review Hearing ( w / in 6 months after permanency planning hearing ) Petition for Petition for Termination of Permanency Yes Parental Rights No Yes Parental Rights Goal Achieved ? Termination ? Filed Original Chart prepared by Michael Curtis on January 12, 2006 No Juvenile Dependency Case Flow (noting FTC) 14
Other FTC Hearings: Check In Hearing: Set for following week after positive/missed UA or noncompliance w/ tx Compliance Clock Hearing: Can be applied after 5th response and set 60 days out from current hearing Motion Hearing: Can be set anytime there is a contested issue. Not heard duringregular FTC calendar Box Color Legend: Red: Not a hearing Green: Beginning and end of FTC Process Blue: FTC Review Hearings Graduated Blue: Does not occur on every case Orange: Not unique to FTC Purple: Unique to FTC and can occur throughout FTC process Discharge/Opt Out Hearing: Dependency dismissed or discharged to regulardependency FAMILY TREATMENT COURT CASE PROCESSING FLOW CHART 15
Evaluation of the King County Family Treatment Court Division of Public Behavioral Health and Justice Policy University of Washington School of Medicine UWHelpingFamilies.org
Needs for the Evaluation • Provide information needed by the KCFTC and its stakeholders • Expand the research base on FTDCs • Do FTDCs achieve their stated goals and outcomes? • Do they contribute positively to federal priorities for CW systems? • Do common criticisms of drug courts apply to FTDCs? • Widening the net of involvement in justice system • Mandate longer involvement in justice system • Limit access to or completion of treatments • Not cost effective
Summary of the FTDC Literature Four studies of FTC model (Boles et al., 2007; Edwards et al., 2005; Green et al., 2007, 2009; Worcel et al., 2008;) All four studies show positive outcomes: Parents enrolled in treatment more quickly Parents received treatment services for a longer mean duration Parents were more likely to successfully complete treatment Children placed in permanent living situations more quickly Children more likely to be reunified (e.g., 42% vs. 27% at 2 years; 70% vs. 45% at 3-4 years) No study found between-group differences in future abuse/neglect reports
Summary of the FTDC Literature NPC Research, the most active evaluators of FTCs and drug treatment courts, has completed several cost-benefit analyses at sites across the nation. The table below summarizes their findings:
Components of the KCFTC Evaluation Process evaluation Interviews with team members and stakeholders, 2006 and 2008 Parent interviews, 2007-2009 Outcomes evaluation Analysis of child placement data from Children’s Administration and adult treatment data from the Division of Behavioral Health and Recovery Cost-benefit analysis Currently underway 22
Respondents 2006 (n=39) 2008 (n=37)
2006: Mean= 3.4 Std. Dev= .793 2008: Mean= 3.73 Std. Dev= .693
2006: Mean= 5 Std. Dev= 1.4 2008: Mean= 5.47 Std. Dev= 1.36
Summary of Process and Function QuestionsMeans A little bit successful Somewhat Successful Moderately successful Extremely successful
What we learned from process evaluation Strengths Strong opinions about the positive impact of KCFTC Most processes and functions viewed as successfully being accomplished by 2008 Relative Weaknesses Respondents less confident that goal of serving a representative population was being met Respondents believed client load was less than optimal (serving too few families) Mixed opinions on the amount of shared vision among team members Certain processes and functions: Efficiency of eligibility determination and intake Consistency and effectiveness of incentives and sanctions Resources and training for KCFTC staff and team members 28
Outcome Evaluation:Research Question 1 • When compared to comparable non-FTDC participants, do FTDC participants differ in terms of their experience with the court and treatment system? • Hypotheses – FTDC participants would: • Have more court hearings; • Enter treatment more often; • Enter treatment more quickly; • Attend treatment sessions more consistently; • Receive more treatment events; • Receive a broader treatment array; • Remain in treatment longer; and • Successfully discharge from treatment more often.
Research Question 2 • When compared to children of non-FTDC participants, do children of FTDC participants demonstrate more positive child welfare outcomes? • Hypotheses – KCFTC children would: • Spend less time in out-of-home placements; • Reunify with their parents more often; • Get placed in permanent living situations more quickly; and • Have fewer subsequent child welfare investigations and founded investigations
Research Question 3 • Do families of color have outcomes similar to families not of color? • Treatment outcomes • Child welfare outcomes
Outcome Evaluation • Administrative data: • Treatment data from Division of Behavioral Health and Recovery • Child welfare data from Children’s Administration • Hearing data from King County Superior Court • Data collected September 2010 • Family Treatment Court group: • Selected all parents admitted to the FTC between March 2006 and October 2009 • Comparison group: • Eligible parents referred but not admitted to the Family Treatment Court • Randomly selected a reasonable number • Statistically matched (propensity score methods) on caregiver age and race, number of prior child welfare investigations, whether parent was in treatment at petition, number of prior treatment episodes, and primary drug of choice
Detail: specific race/ethnicity Parent demographics • Mean # of children per participant • Comparison=1.39 • KCFTC = 1.46 • Parent mean age • Comparison = 31 • KCFTC = 31 • Total # of parents = 268 • Comparison = 182 • KCFTC = 76 Note: no significant differences
Prior Investigations Note: No statistically significant differences
Child demographics • Child Mean Age • Comparison = 4.2 • KCFTC = 3.5 • Number of children • Comparison = 235 • KCFTC = 89 Note: Statistically significant difference for Native American
Note on Analytic Approach… • 1). “Intent to treat” • All parents who were admitted to FTC were included in all analyses, even if they opted out or had an unsuccessful outcome. • No parent who was ever in FTC was ever included in the comparison group • 2). Index Petition Date • “Time Zero” or comparable start point for both groups was the petition date, not date of entry into FTC (comparison group had no date of entry) These decisions likely result in more conservative findings
Question 1: Do FTC participants have different treatment and court experiences than comparable non-FTC parents? • Do they experience more court hearings? • Are they more likely to enter treatment? • Do they enter treatment more quickly? • Are they more likely to attend treatment? • Do they remain in treatment longer? • Are they more likely to be successfully discharged from treatment?
FTC parents have more court hearings • 11 months post petition (mean follow up time for overall sample): • FTC: mean 16.1 (SD = 4.8) hearings • Comp: 5.9 (2.4) • (p<.001) • Review hearings were 4.5 times more frequent for FTC (accounted for 75% of all FTC hearings)
FTC parents are more likely to enter treatment FTC parents were 63% more likely to be admitted to treatment. Note: All differences statistically significant
FTC parents enter treatment three times as fast • Of those parents entering treatment who were not already in treatment at the index petition, the median days until treatment entry were: • Comparison: 120 • KCFTC: 36 Proportion not admitted Note: Statistically significant difference, p < .001
FTC parents received broader service array Of those admitted to any treatment * Statistically significant difference, p < .05
FTC parents received broader service array Of those who received any treatment * Statistically significant difference, p < .05
FTC parents received more treatment but were not significantly more likely to attend treatment • Avg. # of treatment events per person who received treatment: • KCFTC = 116 (SD=97) • Comparison = 51 (SD=57) Note: Statistically significant difference, p < .05 Note: Not statistically significant difference, p =.40
FTC parents remain in treatment longer (Of those entering treatment; N=110) • Of those parents who entered treatment, the median days in treatment were: • Comparison: 44 • FTC: 109 Note: Statistically significant difference at beginning and middle, p < .05
Success in treatment • FTC parents remained in treatment twice as long (median of 109 days compared to 44) • FTC parents 37% more likely to be successfully discharged from treatment (72% compared to 54%) Note: Statistically significant differences, p < .05
Question 2: Do FTC families, compared to similar families who did not receive FTC services, have more positive child welfare outcomes? Specifically: • Do the children of FTC participants spend less time in out of home placement? • Are the children of FTC participants placed in permanent living situations more quickly overall? • Are FTC children more likely to have a permanent placement? • Are FTC participants less likely to have subsequent CPS investigations?
FTC children spend less time in out-of-home placements • Median days in out of home placement: • Comparison: 689 • FTC: 476 Note: Statistically significant difference, p < .05
FTC children end involvement with the child welfare system more quickly • Median days until permanent placement: • Comparison: 813 • FTC: 718 Note: Statistically significant difference, p < .05