Download

1 / 23
230 likes | 403 Vues
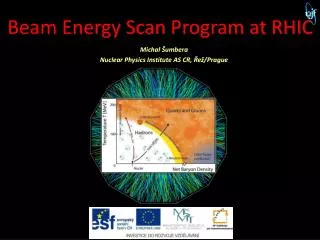
Surface Chronology of Phobos – The Age of Phobos and its Largest Crater Stickney. 3MS³ Symposium, Moscow, 08.-12.10.2012.

E N D
Surface Chronology of Phobos – The Age of Phobos and its Largest Crater Stickney 3MS³ Symposium, Moscow, 08.-12.10.2012 N. Schmedemann1, G. Michael1, B. A. Ivanov2, J. Murray3 and G. Neukum1,1Institute of Geological Sciences, FreieUniversität Berlin, Berlin, Germany; 2Institute of Dynamics of Geospheres, Moscow, Russia; 3Department of Earth Sciences, Open University, Milton Keynes, UK.
Characteristics & Origin of Phobos • shape, spectral characteristics and density similar to primitive (C), D or T-type asteroids (Jones et al., 1990; Giuranna et al., 2011) • Inside Mars synchronous orbit • Instable orbit and potential disintegration/crash within 30-50 Ma (Burns, 1978) • Tidal interactions may have lowered the orbit to current state higher orbit in the past but likely always inside Mars synchronous orbit • Theories on Phobos’ origin include: • capture of an asteroid • in-situ formation with Mars • coalesced debris from Martian ejected material • Irregular shape indicates major collision(s) • Several sets of grooves with yet unexplained origin
Two Cases of Phobos’ Chronology • End-member cases of Phobos’ history • Case A: Phobos was in its current orbit since its formation • Average projectile impact velocities are converted form Mars to Phobos’ orbit • Average impact rate equals Martian impact rate – corrected for different crater scaling • Case B: Phobos is a recently captured Main Belt asteroid • Average projectile impact velocities equals average Main Belt impact velocities • Average impact rate equals average Main Belt impact rates
The Lunar Chronology • Lunar Chronology Function • derived from radioisotopic measurements of lunar rock samples and measurements of the cratering record at the Apollo landing sites Neukum (1983)
Scaling Laws – Conversion of Projectile to Crater Diameters Ivanov (2001; updated 2011) If D < Dsimple to complex transition then Dt ~ D If D > Dsimple to complex transition then = D D – observedcraterdiameter Dt – transient craterdiameter DP – impactordiameter G – gravityaccelerationoftargetbody δ – projectiledensity ρ– targetdensity v – impactvelocity α – impact angle Dsg – strengthtogravitytransitioncraterdiameter (Dt>>Dsg -> gravityregime; Dt<<Dsg -> stregthregime)
Summary Production & Chronology Functions Resulting production and chronology functions for cases A and B
Measurement Areas HRSC Basemap: Wählisch et al. (2010)
Measurement Areas • Average Surface to the West of Stickney: N-S grooves stratigraphically above E-W grooves
Measurement Areas • Area S1: Interior of Stickney
Measurement Areas • Area S2: SRC image of Interior of Stickney; N-S grooves stratigraphicallybelow solitary E-W groove
Randomness Analysis • Analysis according to Michael et al. (2012)
Surface Ages Age of Phobos • Cumulative crater plots of average area west of Stickney • Age of Phobos equals last global resurfacing event (break-up of parent body)
Surface Ages Age of Stickney • Cumulative crater plots of S1 area inside Stickney
Surface Ages • Cumulative crater plots of S2 area inside Stickney
Surface Ages • Comparison of cumulative crater plots of average and S1 area Stratigraphic relations suggest a formation age of E-W grooves of 3.8 – 3.85 Ga
Apex-/Antapex Asymmetry Large (old) craters show apex-/antapex ratio of ~1.5 Phobos is not a recently captured object. Form recent orbit a factor 4 is expected according to Morota et al. (2008).
Conclusion • Production and chronology function were derived for two end-member cases of Phobos’ evolution • Case A: Phobos was always in its current orbit • Case B: Phobos is a recently recently captured MB asteroid • Oldest surface age 4.3-4.4 Ga/ ~3.7-3.8 Ga last global resurfacing/break-up of Phobos parent • Age of Stickney: ~4.2 Ga/ ~3.5 Ga • Surface ages show multiple resurfacing events, probably connected to groove formation • Groove formation appears to be ancient but very young ages can’t be resolved based on current imaging data • Stratigraphic relationships indicate similar formation age of E-W striking grooves in at least two areas around 3.8-3.85 Ga/ 2.9-3.1 Ga • Apex-/antapex asymmetry of large/old craters indicate long cratering history in orbit about Mars • Ratio (1.5) is more than a factor of two less than the expected value (4.1) from current orbit e.g. reorientation event(s with more frequent current position)
Crater Production Function • Lunar production function is used as base line, because the main impactor source is the same on the Moon, Phobos and Main Belt asteroids • Case A • vimpM= 9.4 km/s (Ivanov, 2008) • vescM= 5 km/s • vescP= 3 km/s • vimpP = 8.5 km/s • Case B • Average impact velocities among • Main Belt asteroids are calculated • following (Bottke et al., 1994) • vimpP~ 5 km/s Velocity distribution of 682 Main Belt asteroids D>50 km Bottke et al. (1994)
Chronology Function • Lunar chronology is used as base line, because the main impactor source is the same on the Moon, Phobos and Main Belt asteroids • Case A • Impact probability of Mars (Ivanov, 2001) 0.45 x lunar impact rate • Correction for different crater scaling between Mars and Phobos 0.84 x lunar impact rate (same projectile is forming larger craters on Phobos than on Mars or the same crater size is achieved by smaller projectiles on Phobos)
Chronology Function • Lunar chronology is used as base line, because the main impactor source is the same on the Moon, Phobos and Main Belt asteroids • Case A • Impact rate at Mars (Ivanov, 2001) 0.45 x lunar impact rate • Correction for different crater scaling between Mars and Phobos 0.84 x lunar impact rate (same projectile is forming larger craters on Phobos than on Mars or the same crater size is achieved by smaller projectiles on Phobos) 1 Ga Isochrones 1 Ga isochrones for Phobos and Mars
Chronology Function • Lunar chronology is used as base line, because the main impactor source is the same on the Moon, Phobos and Main Belt asteroids • Case B • Average impact probabilities among Main Belt Asteroids are calculated following (Bottke et al., 1994) Pi ~ 2.9*10-18 km-2/a 2.9*10-9 km-2/Ga • Conversion from intrinsic impact probability to chronology: • f=Pinir2mean(O’Brien and Greenberg, 2005) • f: impact frequency forming craters ≥ 1 km/Ga • Pi: intrinsic impact probability • ni: number of projectiles forming craters ≥ 1 km • observed number of Main Belt asteroids ≥ 10 km (obs. limit): 9554 • crater size on Phobos as average Main Belt asteroid from 10 km projectiles: 104.5 km • correction factor for frequency of 104.5 km craters to 1 km craters based on Phobosproduction function as MBA: 4*103 • ni: 3.8*107 • r: mean radius of target body scaled to unit area = (11 km)²/4π*(11 km)² • f ~ 9*10-3 • (Neukum, 1983)