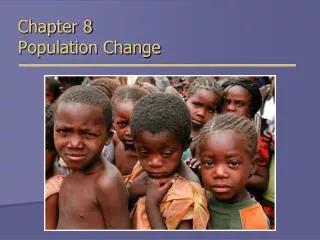
Chapter 8 POPULATION STUDIES
Chapter 8 POPULATION STUDIES. POPULATION DISTRIBUTION, Diversity and Change. Learning outcomes. in this chapter you will learn that: The population cycle explains how birth and death rates change over time Population density varies from place to place

Chapter 8 POPULATION STUDIES
E N D
Presentation Transcript
Chapter 8POPULATION STUDIES POPULATION DISTRIBUTION, Diversity and Change
Learning outcomes in this chapter you will learn that: The population cycle explains how birth and death rates change over time Population density varies from place to place A country’s population structure is shown on a “Population Pyramid” High densities and low densities have social and economic effects Poor countries have higher death rates than rich countries
POPULATION DENSITY THE WORLDS POPULATION IS 6BILLION SOME AREA ARE: VERY DENSELY POPULATED……A LOT OF PEOPLE LIVE IN CERTAIN PLACES VERY SPARSLY POPULATED…..NOT MANY PEOPLE LIVE THERE.
TERMS • POPULATION DENSITY: THE AVERAGE NUMBER OF PEOPLE PER SQUARE KILOMETRE • POPULATION DISTRIBUTION: WHERE ALL THE PEOPLE LIVE IN AN AREA
FOUR AREAS OF HIGH POPULATION DENSITY ARE: • NOTRH-EAST AMERICA • WESTERN EUROPE • INDIA, PAKISTAN, BANGLADESH • CHINA, JAPAN, INDONESIA
What is the population of Ireland in 2005? Ireland’s population 4.1 million
What is the population of the world in 2005? World population 6,477 million Over six billion people living in the world
How big is this figure? • One billion = One thousand million • One billion= 1,000,000,000 • It would take you eleven days to count to one million if you allowed one second for every number you counted
Population growth • In the past, population growth was slow and uneven. • Populations fluctuated because of wars, famine, disease. • People were dying because of a lack of medicine
Today’s population growth • The population of the world is growing: by over 200,000 people every day This means that the birth rates are greater than the death rates = the population grows The birth rate is the number of babies born per year for every 1,000 people in the total population The death rate is the numbers of people dying per year for every 1,000 people in the total population What happens to the population if the death rates are higher than the birth rates??
How do you calculate the population growth? • 40 people are born • 15 people die • 40 – 15 = 25 per 1,000 25/1000 x100% = 2.5 % per year
Where is the population growth happening in the world? • Today most of the population growth is in developing countries: Asia and Africa • This is because people in poorer countries regard children as a source of income. When they retire, their children can provide a wage to help support their family
POPULATION GROWTH • IN RICH COUNTRIES TODAY THE POPULATIONS ARE GROWING SLOWLY • IN POOR COUNTRIES TODAY THE POPULATIONS ARE GETTING BIGGER VERY QUICKLY
SO……...WE CAN USE HOW RICH OR POOR A COUNTRY IS • ……..TO TELL WHAT IS HAPPENING TO ITS POPULATION • LETS LOOK AT EUROPE OVER THE PAST 200 YEARS
STAGE ONE • 200 YEARS AGO THE INDUSTRIAL REVOLUTION HAD NOT STARTED IN EUROPE • MOST PEOPLE LIVED IN THE COUNTRYSIDE AND WERE FARMERS • BIRTH RATES AND DEATH RATES WERE VERY HIGH. Famine, disease and natural disasters caused high death rates
STAGE TWO • As the economy of a country improves, the government spend money on health services and clean water is available • Birth rates remain high • Death rates begin to fall • The population begins to grow
STAGE THREE • Economic growth continues; People are more educated and they begin to plan family sizes. • Families have fewer children so the birth rates begins to fall • Death rates are still low
STAGE FOUR • Countries are wealthy in this stage. • Parents continue to plan their family size • Birth rates are low • Death rates are low as most people survive to old age • Ireland is considered to be at this stage now
Stage 5 • The death rate is higher than the birth rate because the population is now elderly • Women are having fewer children • Germany is at this stage now
Factors that affect population change • Food Supply • Improved Technology • Health • War • Status of Women • Education
Food supply affects population growth Food supply
Examples of food supply affecting populations in Ireland and Brazil • 1800 Ireland had population of 4.5 million • Potato was main food. • By 1845 population grew to 8 million • 1845-1848 famine. 1 million died • 1900 Brazil: population was 17 million • 2007 population was 192 million. Why? • Immigration and high birth rates • Farmers cleared land for agriculture-rice, maize, vegetables and fruit
2. Improved Technology helps with population growth Improved technology
Examples of how health is different in rich and poor countries • Rich country: water supply available: Safe drinking water and sanitation • Disease such as Tuberculosis has been wiped out due to availability of medication • Poor countries: Water not available in rural areas. They have a well which is unsafe-contaminated by animals….cholera
Population Pyramids • Population pyramids show the structure of the population • Age structure of the population. This is the proportion of people in different age groups. • Sex structure of the population. This is the proportion of males to females.
POPULATION STRUCTURE The population pyramid displays the age and sex structure of a country or given area FEMALES To the right MALES To the left OLD DEPENDANTS ECONOMICALLY ACTIVE YOUNG DEPENDANTS Population in Five Year Age bands Usually, but not always, In % to make for easier comparisons between countries
Brazil is a country with a rapidly expanding poulation. • A wide base tells us that birth rates are high: • Lack of family planning, high rate of infant mortality, traditional role of women in society • A narrow peak tells us that death rates are high: this is because of • poor living standards, lack of good food, poor medical services, lack of clean water
Germany is a developed country • A narrow base indicates low birth rates. • This is because of high rates of education = family planning, low infant mortality rates, women work outside the home, good access to medical services, Germany is industrialised so children are not needed to work in the primary sector (digging fields, mines) • A wide peak indicates low death rates: this is due to high living standards, good medical services and a developed economy
Ireland is a developed economy • A narrow base indicates low birth rates but there is an increase in the 0-4 age category in ireland • The reasons are the same as Germany..education/family planning… • The wide peak indicates low death rates as older people live longer. Life expectancy is high. Women live on average to 80 yrs and 75 for men in Ireland • Why?
Life Expectancy • Life expectancy is the average number of years which new born children can be expected to live.
Let’s look at page 215 of our book: Question 2which pyramid represents a developing country and why?Calculate the percentage of the population that is 4 years and under.
Question 1 on page 215: look at the information on the table and answer the following questions(B) IN WHICH TABLE ARE THE 2 DEVELOPED COUNTRIES?(B) WHICH IS THE LEAST DEVELOPED COUNTRY?
2012 junior cert geography paperName 1 country similar to Aname one country similar to Bexplain why B has wider base than Aname 2 uses of population pyramids
Population density and population distribution • Population density = average number of people living in a square kilometre. Areas with high population densities can have problems such as overcrowding, lack of clean water, pollution and lack of open spaces • Population distribution = the dispersion of people around the world: where people live. It is very uneven. People avoid very hot, dry, humid or cold areas. Example-Sahara desert, Greenland