Download
1 / 70
700 likes | 883 Vues
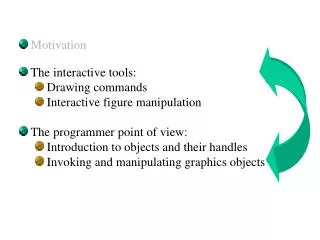
Motivation The interactive tools: Drawing commands Interactive figure manipulation The programmer point of view: Introduction to objects and their handles Invoking and manipulating graphics objects. The interactive tools. >> x = -5:0.05:5; % [-5 -4.95 …….4.95 5] >> y = sin(x.^2) ;

E N D
Motivation • The interactive tools: • Drawing commands • Interactive figure manipulation • The programmer point of view: • Introduction to objects and their handles • Invoking and manipulating graphics objects
The interactive tools >> x = -5:0.05:5; % [-5 -4.95 …….4.95 5] >> y = sin(x.^2); >> plot(x,y)
The axes is contained within the figure. • A figure may have more than one axes.
The plot is contained within the axes. • An axes may have more than one plot.
>> y2= 1./(1+exp(-x)); >> hold Current plot held >> plot(x,y2,'color','k','lineStyle','-.')
>> y2= 1./(1+exp(-x)); >> hold Current plot held >> plot(x,y2,'color','k','lineStyle','-.') Property-name, property value pair
>> y2= 1./(1+exp(-x)); >> hold Current plot held >> plot(x,y2,'color','k','lineStyle','-.') Property-name, property value pair
Specifier Line Style Specifier Marker type - solid line (default) + Plus sign o circle -- dashed line * asterisk : dotted line . point -. dash-dot line x cross s square Specifier Color d diamond ^ triangle pointing upward r Red v triangle pointing downward g green > triangle pointing right b blue < triangle pointing left c cyan p five-pointed star (pentagram) m magenta h six-pointed star (hexagram) y yellow k black w white
Alternative format: >> x=[1 2.3 4 10 3 11.3]; >> y=[3.2 5 2 7.4 3 9.4]; >> p2=plot(x,y,'or:’);
Alternative format: >> x=[1 2.3 4 10 3 11.3]; >> y=[3.2 5 2 7.4 3 9.4]; >> p2=plot(x,y,'or:’); Marker ColorLineStyle • Use MATLAB help. • Consult the property inspector. There are more alternative formats
Specialized 2D plots • Bars • Histograpms • Stair • Stem • Scatter • Error bars • Area • Pie charts • contour
Use MATLAB help and demos. Specialized 3D plots • plot3 • mesh • surf
The programmer’s point of view: • Graphic Objects • Handles • Properties
Graphic Object (figure, axes, text, line etc.) handle
Graphic Object (figure, axes, text, line etc.) handle properties
Graphic object: any element as defined by the set of its properties that constitute part of a figure • Everything inside a figure window is a graphic object • The figure window itself is a graphic object • All plots in MATLAB are made of graphic objects • All graphic objects have properties that control the way they look and behave
>> t = -pi:0.05:pi; >> x = cos(3*t)*1./(1+exp(-t)); >> y = sin(3*t)*1./(1+exp(-t)); >> p = plot(x,y) p = 158.0055 A handle
Objects • The plot • The axes • The figure • ? • Handles • p is the plots handle • ? • ?
>>set(p,'color','r') >>set(p,'lineWidth',4) handle
>>set(p,'color','r') >>set(p,'lineWidth',4) property names
>>set(p,'color','r') >>set(p,'lineWidth',4) property values How would I know what properties does the plot have?
>> get(p) Color: [1 0 0] EraseMode: 'normal' LineStyle: '-' LineWidth: 4 Marker: 'none' MarkerSize: 6 MarkerEdgeColor: 'auto' MarkerFaceColor: 'none' XData: [1x126 double] YData: [1x126 double] ZData: [1x0 double] BeingDeleted: 'off' ButtonDownFcn: [] Children: [0x1 double] Clipping: 'on' CreateFcn: [] DeleteFcn: [] BusyAction: 'queue' HandleVisibility: 'on' HitTest: 'on' Interruptible: 'on' Selected: 'off' SelectionHighlight: 'on' Tag: '' Type: 'line' UIContextMenu: [] UserData: [] Visible: 'on' Parent: 157.0059 DisplayName: '' XDataMode: 'manual' XDataSource: '' YDataSource: '' ZDataSource: ''
handle >> p_parent=get(p,'parent') p_parent = 157.0059
property name >> p_parent=get(p,'parent') p_parent = 157.0059
property value >> p_parent=get(p,'parent') p_parent = 157.0059
>> p_parent=get(p,'parent') p_parent = 157.0059 p_parent is a handle. Of what? >> get(p_parent,'type') ans = axes
>> get(p_parent,'children') ??? ans = 158.0063 >> p ans = 158.0063
>> set(p_parent,'xcolor','b'); >> set(p_parent,'ycolor','b'); What about the title? >> title=get(p_parent,'title') title = 163.0059 >> get(title,'type') ans = text
>> set(p_parent,'xcolor','b'); >> set(p_parent,'ycolor','b'); What about the title? >> title=get(p_parent,'title') title = 163.0059 >> get(title,'type') ans = text >> set(title,'string','Spiral') >> set(title,'color','b')
Lets add another line >> x1 = -cos(3*t)*1./(1+exp(-t)); >> y1 = -sin(3*t)*1./(1+exp(-t)); >> plot(x1,y1) Ooooops… >> lines = get(p_parent,'children') lines = 204.0061 158.0063 >> blue=lines(1) blue = 204.0061 >> set(blue,'lineWidth',4)
Alternatively: >> findobj('color','b') ans = 204.0061
Who is the title’s parent? Who are the title’s children? Who is the axes` parent? Who is the figure’ parent?
Graph Objects Phylogeny • This hierarchy is based on the interdependency of objects. A line can only be plotted inside an Axes. A figure contains Axes and so on.
Graph Objects Phylogeny parent
Graph Objects Phylogeny children
…in the beginning there is only the root object…. • Hello, I am the root object • Although I am the root I always got a 0 as my handle • I know and control many important things… Type get(0) to see all my properties
What is the difference between a handle and “simple variable”? >> get(title,'String') ans = Spiral >> ttt = title; >> set(ttt,'string','Red wide spiral') >> get(title,'String') ans = Red wide spiral >> a = [1 2 3 4 5]; >> b = a; >> b(3)=9 b = 1 2 9 4 5 >> a a = 1 2 3 4 5
handle right_handle = handle