Download
1 / 5
50 likes | 69 Vues
Explore the observations of climate change before and after, including temperature data, carbon emissions, and the need for geoengineering methods.

E N D
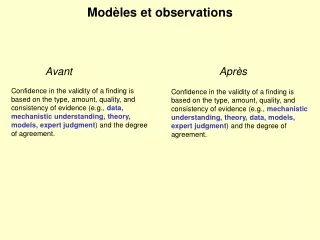
Modèles et observations Avant Après • Confidence in the validity of a finding is based on the type, amount, quality, and consistency of evidence (e.g., data, mechanistic understanding, theory, models, expert judgment) and the degree of agreement. • Confidence in the validity of a finding is based on the type, amount, quality, and consistency of evidence (e.g., mechanistic understanding, theory, data, models, expert judgment) and the degree of agreement.
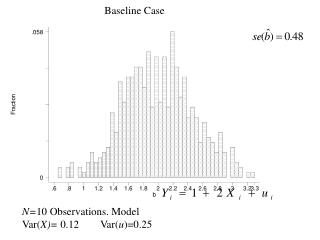
Observations: atmosphère Avant Après • [Dans la partie observations] • The globally averaged combined land and ocean surface temperature data show an increase of 0.89 [0.69 to 1.08] °C 3 over the period 1901–2012. Over this period almost the entire globe has experienced surface warming. (Figure SPM.1). {2.4.3} • [Note dans la partie projecions] • Using HadCRUT4 and its uncertainty estimate (5−95% confidence interval), the observed warming to the reference period 1986−2005 used for projections is 0.61 [0.55 to 0.67] °C for 1850−1900 (…) • [Dans la partie observations] • The globally averaged combined land and ocean surface temperature data as calculated by a linear trend, show a warming of 0.85 [0.65 to 1.06] °C3, over the period 1880 to 2012, when multiple independently produced datasets exist. The total increase between the average of the 1850–1900 period and the 2003–2012 period is 0.78 [0.72 to 0.85] °C, • based on the single longest dataset available4 (see Figure SPM.1). {2.4} • 4: Both methods presented in this bullet were also used in AR4. The first calculates the difference using a best fit linear trend of all points between 1880 and 2012. The second calculates the difference between averages for the two periods 1850–1900 and 2003–2012. Therefore, the resulting values and their 90% uncertainty intervals are not directly comparable. {2.4} Proposition de tout présenter dans la partie observations
Cycle du carbone • Cumulative CO2 emissions20 for the 2012 to 2100 period compatible with the RCP atmospheric CO2 concentrations, as derived from 15 Earth System Models, range18 from 140 to 410 GtC for RCP2.6, 595 to 1005 GtC for RCP4.5, 840 to 1250 GtC for RCP6.0, and 1415 to 1910 GtC for RCP8.5 (see Table SPM.3). {6.4} • • By 2050, annual CO2 emissions derived from Earth System Models following RCP2.6 are smaller than 1990 emissions (by 14 to 96%). By the end of the 21st century, about half of the models infer emissions slightly above zero, while the other half infer a net removal of CO2 from the atmosphere. {6.4, Figure TS.19} Avant Après • Cumulative fossil fuel emissions for the 2012−2100 period compatible with the RCP atmospheric CO2 concentrations, as derived from CMIP5 Earth System Models, are 270 (140 to 410) PgC for RCP2.6 , 780 (595 to 1005) PgC for RCP4.5, 1060 (840 to 1250) PgC for RCP6.0, and 1685 (1415 to 1910) PgC for RCP8.5. For RCP2.6, an average emission reduction of 50% (range 14% to 96%) is required by 2050 relative to 1990 levels. It is about as likely as not that sustained globally net negative CO2 emissions, i.e., net removal of CO2 from the atmosphere, will be required to achieve the reductions in atmospheric CO2 in this scenario by the end of the 21st century. {6.4.3}
Emissions cumulées de CO2 / cibles Avant Après • Based on the assessment of TCRE, cumulative CO2 emissions from all anthropogenic sources would • need to be limited to about 1000 PgC since the beginning of the industrial era, if the warming caused by anthropogenic CO2 emissions alone is limited to be likely less than 2°C relative to pre-industrial. About half of this budget, estimated in the range of 460 to 630 PgC, was already emitted by 2011. Accounting for the projected warming effect of non-CO2 forcings, a possible release of greenhouse gases from permafrost or methane hydrates, or requiring a higher likelihood of temperatures remaining below 2°C, all imply a substantially lower budget. (see Figure SPM.9). {12.5.4} • Limiting the warming caused by anthropogenic CO2 emissions alone with a probability of >33%, >50%, and >66% to less than 2°C since the period 1861–188022, will require cumulative CO2 emissions from all anthropogenic sources to stay between 0 and about 1570 GtC (5760 GtCO2), 0 and about 1210 GtC (4440 GtCO2), and 0 and about 1000 GtC (3670 GtCO2) since that period, respectively23. These upper amounts are reduced to about 900 GtC (3300 GtCO2), 820 GtC (3010 GtCO2), and 790 GtC (2900 GtCO2), respectively, when accounting for non-CO2 forcings as in RCP2.6. An amount of 515 [445 to 585] GtC (1890 [1630 to 2150] GtCO2), was already emitted by 2011. {12.5}
Géoingénierie Des méthodes visant délibérément à contrer le changement climatique, regroupées sous le terme de géo-ingénierie, ont été proposées. Il existe peu d’éléments permettant d’évaluer quantitativement et de manière complète les techniques de gestion du rayonnement solaire (SRM) et de prélèvement du dioxyde de carbone (CDR), ainsi que leur incidence sur le système climatique. Les méthodes de type CDR présentent des limitations biogéochimiques et technologiques quant à leur potentiel à grande échelle. Nous ne disposons pas de connaissances suffisantes pour quantifier dans quelle mesure les émissions de CO2 pourraient être réduites grâce au CDR à l’échelle du siècle. La modélisation fait apparaître que certaines méthodes de SRM, si elles sont réalisables, peuvent compenser significativement une augmentation de la température du globe, mais celles-ci modifieraient également le cycle mondial de l’eau et ne réduiraient pas l’acidification des océans. Si la SRM prenait fin pour une quelconque raison, on peut affirmer, avec un degré de confiance élevé, que la température moyenne de la surface du globe augmenterait très rapidement jusqu’à atteindre des valeurs correspondant au forçage dû aux gaz à effet de serre. Les méthodes de CDR et de SRM présentent des effets secondaires indésirables et ont des conséquences à long terme à l’échelle du globe. {6.5, 7.7}