Download
1 / 36
360 likes | 405 Vues
Explore the distribution and changes of urban population density within a city. Discover factors influencing density gradients, historical influences, and socioeconomic patterns shaping urban areas.

E N D
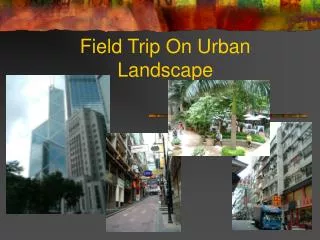
C.2. Urban Landscape Urban population density
Why study urban population density? Residential land use being the most important land use in a city Spatial distribution of population Temporal changes of population distribution Urban population density curves
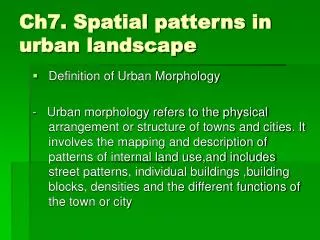
Gradients of population density with cities (Gradient analysis) • Two notable features (1) Absence of residential population in city center (Central crater) (2) Decline of population density from inner parts of the city to its periphery.
Distribution of population density within a city Residential population density: • decline with increasing distance from the city centre • negative exponential decline of density with distance • Temporal changes of population density
LDC cities Rio de Janeiro, Bangkok, Dhaka, Mexico City
MDC cities London, Tokyo, Paris, Los Angeles
Population density curves Central density Peak density Peripheral density Density gradient Areal extent
Large-scale rural-urban migration • The population density of the whole urban area continues to rise through time with the highest population density always at the city centre. • The density gradient has remained relatively constant from the centre • There is a horizontal expansion of the city • But the extent is much smaller than that of the MDCs because of late start of urbanisation and suburbanisation affected by poor infrastructure.
Suburbanisation • In early stages, population density in the city centre increases • But as time passes, the density gradually exhibits a declining trend • People move out and leave a density crater at the city centre • Outward movement extends the city fringe • As the population growth in the MDCs is small, the continued horizontal expansion of urban area leads to flattening out of population density very gentle density gradient
Reasons for the spatial and temporal changes of population density within a city TRANSPORT • The most desirable, hence most expensive, site for all urban land uses lie close to the city center, where maximum accessibility is provided by converging transport routes ECONOMIC FACTOR • The further a site is from the city center, the greater are the transport costs involved in its use. • but because of reduced competition, land rent of such sites is lower • These lower land values encourage lower intensity of use away from the city center lower intensity of land use for residential and other uses.
Reasons for the spatial and temporal changes of population density within a city SOCIO-ECONOMIC FACTOR • Low – income groups tend to live closer to center for more immediate accessibility to their working places and lower transport costs. • As a result, the poor live in small amounts of the valuable / expensive lands and live at high densities • High – income groups can afford the time, cost and inflexibility of longer daily journeys between the periphery and city centre Land is cheaper on the outskirts of a city, thus the rich consume more of it for their larger and more wide of spaced house.
Reasons for the spatial and temporal changes of population density within a city HISTORICAL FACTOR • Due to historical process of urban development there would be a tendency for lower densities in the newly-developed areas than in the older earlier developed residential areas.
Reasons for the spatial and temporal changes of population density within a city • Increase of suburban manufacturing and retailing / commerce around the fringes of large cities now attracted residential settlement, producing multi-centred urban settlements produces lower density gradient by increasing the attraction of the suburbs and lowering the attraction of the city center • Access to open space in suburban areas • increasing attraction of suburbs • complicating the pattern of land values in suburbs
Variations in the rates at which population densities decrease Due to • different per capita car ownership • the proportion of manufacturing jobs available • the extent of “twilight” zones • the cost of public transport • the age and extent of the urban area
Temporal changes of population density inWESTERN and NON-WESTERN Cities
At time t, in the early stage of growth • Residential densities are very high towards the center but decrease rapidly with increasing distance from the city center • This reflects the early central location of factories are the absence of effective means of public transport
At T1, centrifugal movement of residential population is made possible by increasing flexible transport system with the city periphery • The area of maximum density moves outwards from the city center as the commercial core expands and redevelopment of old central housing occurs
Densities decline sharply in city centre (where commercial and industrial functions displace former residents), but increase and reach further out into the suburbs with the growth of commuting • This reflects the impact of urban planning, which aims to achieve lower residential densities
The density gradient therefore becomes more gentle • Suburbanization helps to flatten the shape of the density curve by increasing the area of city.
There is a continual increase of densities throughout the whole urban area, that is densities increase while the gradient remains the same • Due to the rapid centripetal movement of residential population from rural areas to urban areas, i.e. rural-urban migration.
Because • there is crowded downtown area with dense population and congestion, as people who move up socio-enonomic ladder and reside here • They push up the slope of the density curve near and around the city centre • at the same time, the periphery becomes crowded with migrants from the surrounding countryside • The poor transport systems push outwards more slowly than western cities of similar populations. • They therefore tend to be more compact and have greater overall population densities
Changing population density around the city centre over time
Describe the peak density. - Flatten • Peak is lower and shifts away from centre
Explain Positive reasons: Suburbanization • Higher mobility • Higher income • Desire for better living environment
Negative reasons: Redevelopment • Slum clearance • Density control • Job opportunity, housing provision in suburban area
What are the environmental implications of the changes in population density? 1. Improvement of inner environment • More open space • Removal slum areas 2. Traffic congestion, pollution 3. Urban encroachment into rural
Draw a population density curve from Central to Shatin. • Include the following places: Central / TST, Mongkok/Yau Ma Tei, Kowloon Tong, New Kowloon, Shatin/Tai Po
HK urban population density • 3 peaks+ 3 craters
Explanations Peaks : high accessibility; public housing; suburban(new towns) Craters : CBD, high-income residential areas, rural
HK Urban land rent • Rent declines with increasing distance from centre • High peaks, Mini peaks, Trough
High peaks: CBD, high-income residential areas • Mini peaks: new town, traffic intersection • Trough: squatters, rural