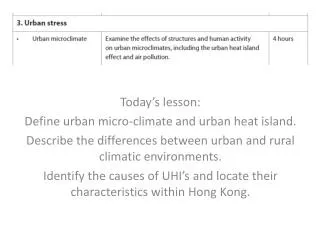
Part 2: Urban climate
Part 2: Urban climate. Dr Janet Barlow Department of Meteorology, University of Reading j.f.barlow@reading.ac.uk MSc Intelligent Buildings March 2009. Outline: Urban Climate. Why focus on urban climate? How does an urban area affect the atmosphere? How can we improve the urban climate?

Part 2: Urban climate
E N D
Presentation Transcript
Part 2: Urban climate Dr Janet Barlow Department of Meteorology, University of Reading j.f.barlow@reading.ac.uk MSc Intelligent Buildings March 2009
Outline: Urban Climate • Why focus on urban climate? • How does an urban area affect the atmosphere? • How can we improve the urban climate? • Climate change cf. urban climate?
Urbanization of world population • 1800 – 3% urban • 1900 – 14% • 1950 – 30% (83 cities >1M) • 2000 – 47% (76% in WDC, 40% in LDC) By 2030 the world’s population is projected to be 60% urban, most of the growth in LDC.
Tokyo-Yokohama – world’s largest urban area by population: 34,350,000 people 7,835 km-2 area Source: “World Urban Areas: Population and Density”, 4th ed.(2008), Demographia www.demographia.com
Why study urban atmospheres? • Higher percentage of population experiencing urban climate • Urban microclimate has distinct characteristics • Source area of many pollutants • Better design can be used to mitigate climate …Cities responsible for an estimated 80% of carbon emissions! (WMO)
London! San Francisco! Nice! Manchester!
How is an urban surface different to a rural surface? • random array of obstacles, in horizontal and vertical • “patchy” – inhomogeneous surface type • rough surface (causes turbulence) • warmer surface (range of building materials) • sources of heat and pollution released at ground level • reduced surface moisture
Wind over urban areas…street scale • Define street canyon: two parallel rows of uniform height buildings • Flow in a street depends on aspect ratio, i.e. ratio of height (H) to width (W): • a) isolated roughness H/W <0.3 • b) wake interference 0.3<H/W<0.6 • c) skimming flow H/W>0.6 • Flow pattern determines flux of heat or pollution out of street
Research: flow visualisation in a wind tunnel flat roof H/W=0.6 flat roof H/W=1.0 high pitch H/W=0.6 high pitch H/W=1.0 Model scale ~1:400 ~400 times faster than in nature!!!
Design influences heat flows • So shape and layout of buildings can be changed to optimise ventilation: • Exchange hot, polluted street air • With cool, clean air above • Next, consider where the heat is coming from….and going to! • The surface energy budget
Reflection of sunlight (shortwave radiation) • Materials used quite dark (e.g. tarmac, slate tiles, stone) • Reflect less sunlight • Define albedo: the fraction of incident shortwave radiation which is reflected • = 0 (no reflection) • = 1 (total reflection) e.g. tarmac ~ 0.05-0.1 grassland ~ 0.1-0.2 snow ~ 0.4-0.7
Emission or absorption of heat (longwave radiation) • Some built materials have highheat capacity, low thermal conductivity • they store heat, release it slowly (e.g. stone, brick, concrete) • Some materials have low heat capacity, high thermal conductivity • they heat up rapidly to high temperatures, and cool down rapidly (e.g. “Cat on a Hot Tin Roof”!) • Typically, urban areas store heat, release it slowly
Turbulent transfer of heat from the surface • Movie! • Buoyant, hot air rising from concrete • Hot air less dense • Shimmering shows turbulence! • Surface temperature higher than air temperature (day) • Flux of heat from ground to air If air temperature higher than surface temperature (night) • Flux of heat from air to ground = sensible heat flux • Sunlight evaporates water • Flux of moisture into air Surface energy used up in evaporation (so surface cools!) Flux of energy into air = Latent heat flux
Turbulent heat flux into air Vapour flux into air Storage of heat in surface Net radiation Heat flux into ground = + + + Surface energy budget Surface reflects short-wave radiation (S) according to its albedo (), and absorbs and emits long-wave radiation (L) according to its temperature and emissivity. QS Q* = (1-) S + L – L Q* = QG + QH + QE + QS
reduced latent heat flux • increased storage heat flux into building fabric • delayed peak in sensible heat flux • delayed transition to downward heat flux during the night Vancouver Cleugh and Oke (1986) local solar time (hrs)
Nighttime urban heat island (composite of thermal IR images taken at 03:27 on August 6-10 1998) Paris by daytime (composite of thermal IR images taken at 13:28 August 6-10 1998) Dousset and Gourmelon, 2003
Urban Heat Island • Urban areas can be several degrees warmer than surrounding areas. This effect is strongest at night with low wind and clear skies. • Maximum temperature difference is observed not long after sunset, due to slow release of heat from storage in urban buildings vs. rapid cooling of rural area Oke, 1987, “Boundary Layer Climates”
Urban heat island mitigation 1: some methods High albedo roofs High albedo pavement Pervious concrete Uni. Of Arizona: asusmart.com
Urban heat island mitigation 2: green roofs Q: how does a green roof change the surface energy balance? Q: what impact does a green roof change have on energy use? water cycle? livingroofs.org www.risc.org.uk/garden/
Climate change cf. urban climate? • So…. What are the impacts of climate change compared to URBAN climate change? • Case Study: Adaptation of buildings in London, UK • Taken from a study by Arup • “Beating the Heat: Keeping UK buildings cool in a warming climate” • Hacker, Belcher and Connell (2005), UKCIP Briefing report, UKCIP, Oxford
Climate change and urban areas? • Smoothed daily mean temperature, UK regions • UKCIP09, “The Climate of the UK and Recent Trends” • London’s Urban Heat Island is intensifying...
UK TEMPERATURE FUTURE RISE Medium-high emissions scenario 2020s 2050s 2080s UK Climate Impact Programme predictions UKCIP02 Look for updated predictions soon!! www.ukcip.org.uk
City heat in the future CIBSE (Chartered Institution of Building Services Engineers) Design Summer Year “morphed” for 2050s (Hacker et al., 2005)
Heat flows in a building (Hacker et al., 2005)
Adaptation of existing buildings Typical Victorian C19th Townhouse Scenario 1: no adaptation
Adaptation of existing buildings • Typical Victorian C19th Townhouse • Scenario 2: adaptation • Shuttering on windows reduces solar gain • Mechanical ventilation (at least 0.5 roomchanges per hour) Thermal comfort achieved BUT Air conditioning system causes MORE carbon emissions!
What have we found so far? • The world’s population is predominantly urban, and urban areas are responsible for LOTS of carbon dioxide emissions • Urban heat island is a function of city size and form – INDEPENDENT of climate change! • Building shape and layout influence wind flow and ventilation • Building materials influence heat flows • BOTH factors control urban climate • AND can be adapted! • BUT urban design should not WORSEN climate change • Good design both mitigates and adapts
Further reading • Oke, T.R. (1987) Boundary Layer Climates, 2nd ed, Methuen • - chapter on urban climates • Stull, R.B. (1997) An Introduction to Boundary Layer • Meteorology, Kluwer Academic • - good for boundary layer theory • Turco, R.P. (2002) Earth under siege: from air pollution to global change, Oxford University Press • http://www.urbanclimate.net • - weather statistics, news, conferences about urban areas • http://www.urban-climate.org • - website of the International Association for Urban Climate – free to join!