Download
1 / 15
150 likes | 230 Vues
Explore correlations between lightning and radar data to differentiate severe and non-severe storms, analyzing storm structure and environmental influences. The study compares various parameters to enhance storm tracking and severity prediction. Hundreds of storms analyzed, showing relationships between lightning characteristics and radar parameters. Estimated peak currents, flash density, and multiplicity exhibited varying trends based on storm type and location. Significant correlations were identified, emphasizing the valuable insights radar parameters offer in understanding lightning activity.

E N D
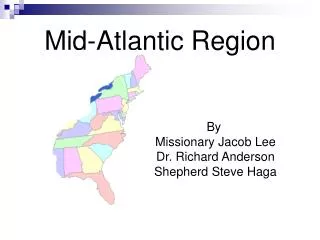
Relationships between Lightning and Radar Parameters in the Mid-Atlantic Region Scott D. Rudlosky Cooperative Institute of Climate and Satellites University of Maryland at College Park Henry E. Fuelberg Department of Earth, Ocean, and Atmospheric Science Florida State University Southern Thunder Workshop Wednesday 13 July 2011
Research Objectives • Determine relationships between lightning and radar to better differentiate between severe and non-severe storms • Examine environmental influences on storm structure, severity, and lightning production in the Mid-Atlantic region • Compute correlations between CG and IC characteristics, and also between lightning and radar parameters • Investigate how storm structure (isolated vs. line/multicell) influences lightning production and its relation to storm severity • Compare IC products at 2×2 and 8×8 km resolutions with both CG lightning and radar-derived parameters to investigate the suitability of the coarser GLM resolution
Warning Decision Support System Cluster IDs K-means Clusters Composite Reflectivity Reflectivity at -20 C • Generate lightning and radar products • NLDN, LDAR/LMA, GLM-FED • RUC-derived near-storm environment • WSR-88D, plus merged parameters • Identify and track individual storm cells • Track total lightning and radar parameters within individual storms • Many variations of parameters • Prepare storm database • Automated procedures • Statistical analyses of many lightning and radar-derived parameters Flash Initiation Density Flash Extent Density
Study Overview • Introduces our analysis methods and the resulting storm database • Many storms on 61 case study days • Compare and Contrast • Severe versus Non-Severe • Isolated versus Line/Multicell • Total Storms = 1667 (1245) • 58,969 (34,953) 2-min points = 1966 h • Average duration = ~71 min • 460 Severe • 1207 Non-Severe Mid-Atlantic Study Domain • Sample size (N) strongly influences our statistical results
Additional Details • Storms were selected based on their duration and relative location • Storms were defined as 1) severe or non-severe and 2) isolated or line/multicell throughout their entirety • Study only examines the maximum values for each storm time/location (vs. average values)
Synoptic and mesoscale systems influence storm-scale distributions • Manual inspection of all 1667 storms revealed several recurring features • Spatial GIS plots illustrate these features • Display average values for each grid cell • Average hour shows the importance of diurnal heating in this region Average Hour (UTC) • Line/multicell storms are more numerous and typically last longer • Isolated (severe) storms occur most frequently over central Maryland Line/Multicell Percentage Severe Percentage
Storms exhibit considerable variability within the Mid-Atlantic Region • IC-FED illustrates the decreasing LMA DE with increasing range • This limitation restricted our intercomparison of lightning and radar to within 150 km of the LMA • -CG Characteristics • Flash density exhibits no clear maximum • Multiplicity and estimated peak current are greatest in the coastal regions and line/multicellstorms 0047 UTC IC Flash Extent Density -CG Flash Density -CG Multiplicity -CG Peak Current 0054 UTC
Values of individual lightning and radar parameters can describe the likelihood that a given storm is severe or non-severe • MESH > 15 mm • 53.7% vs. 18.2% • H30above263K > 6 km • 67.5% vs. 24% • IC-FED > 1 • 61.9% vs. 28.5% • -CG Density > 0.1 • 67.4% vs. 37.3% • Flash density units are flashes km-2 min-1
Correlations help identify relationships between lightning and radar parameters • Confirmed several relationships that previously had only been documented in relatively few storms • Flash-based IC products are better correlated with CG lightning and radar-derived parameters than are source-based products • MESH, a composite of several radar parameters, is better correlated with IC–FED (0.542) than –CG flash density (0.482) • Strong correlation between 2×2 km and 8×8 km IC-FED (0.935) • Both resolutions are similarly correlated with CG and radar parameters • Suggests that the GLM will provide valuable storm-scale IC information comparable to the 2–D information provided by local LMA networks
Profile histograms illustrate relationships between lightning and radar parameters • Relationships are similar in both severe and non-severe storms
Additional Results • -CG flash density, multiplicity, and peak current are intercorrelated and directly related to the height of 30 dBZ above -10˚C • -CG multiplicity and Ip are inversely related on the storm scale, and are greatest in deep (line/multicell) storms • Line/multicell storms were more intense than isolated storms in our database (i.e., greater flash rates and stronger radar-derived parameters) • +CG peak current is inversely correlated with IC lightning and radar-derived measures of storm intensity
Summary • Demonstrated our ability to examine many lightning and radar parameters in a large number of storms • Revealed storm-scale relationships between CG and IC characteristics, and also between lightning and radar parameters • Identified differences between isolated and line/multicell storms • Showed that individual lightning and radar parameters can help determine the likelihood that a given storm is severe • Combinations of CG and IC datasets will ensure that these data are used to best advantage both now and in the future
Case Study 13-14 May 2007 Much of Florida was experiencing a severe drought as a surface cold front approached the area Okefenokee wildfires were producing widespread smoke Two distinct regions of storms Drier environment to the north Sea-breeze induced convergence to the south • Both regions initiate wildfires and produce severe weather 13 May 2007 11 May 2007
Storms nearest the active wildfires produce predominately +CG flashes Smoke-enhanced +CG production Observed in storms directly associated with the source fires, and also in storms at long distances down wind Reversed polarity charging likely is related to… Strong updrafts (less entrainment) Smoke-related CCN (larger, but fewer) increased competition Greater supercooled water content in the mixed phase region Strong +CG flashes often exhibit both large Ip and LCC Red = +CG Northern Storms Blue = -CG Southern Storms