Download
1 / 19
190 likes | 353 Vues
Managing Lower Trophic Level Species in the Mid-Atlantic Region. Forage Fish Workshop Mid-Atlantic Fishery Management Council Raleigh, North Carolina 11 April 2013 E. D. Houde. Northwest Atlantic Coastal and Shelf Ecosystems. Productive Coastal Zone Major Productive Estuaries

E N D
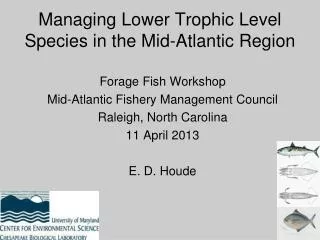
Managing Lower Trophic Level Species in the Mid-Atlantic Region Forage Fish Workshop Mid-Atlantic Fishery Management Council Raleigh, North Carolina 11 April 2013 E. D. Houde
Northwest Atlantic Coastal and Shelf Ecosystems Productive Coastal Zone Major Productive Estuaries Connected to Southern New England and Georges Bank Connected to South Atlantic shelf ecosystems Bounded by the Gulf Stream Strongly seasonal
Productivity of NW Atlantic Shelf Ecosystems Primary Production Productivity on a par with Southern New England and Georges Bank Chlorophyll a NEFSC Ref Doc 12-07
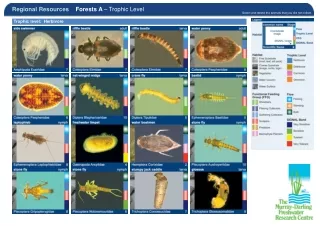
Candidate MA Forage Species Species Fished Retained Discarded BycatchBycatch ___________________________________________________________________ Butterfish yes yesyes Atl. mackerel yes no yes Longfin squid yes yesyes Illex squid yes yesyes Atl. herring yes ? yes Atl. Menhaden yes no yes River herrings no no ? yes Sand lance no nono Round herring no no yes Sardines no no ? Anchovies no no ? Who are the Major Predators?
Regular info input to OFL/ ACL/ABC process Address in Primary fishery Get data, be precautionary Increase buffer to OFL proxy Apply Regular ABC Control Rules Mild increase to OFL buffer Treat as NS 1 Ecosystem Component species Stop, Apply Regular ABC Control Rules NEW N Is this a forage stock? Y N Is the stock retained in a fishery? Y Y Is this a bycatch only fishery? N Are there adequate biomass data? N N Are there adequate catch (landings) data? Y (Use B proxies) Y Are stock catch (landings, or B proxies) <, =, or > PP threshold? > N Is there an accepted stock assessment/ w/OFLs? <, = Y Y N N Does SA consider predation at all? Are Landings (catch) stable? Y N Does SA include predation directly (M2)? Decrease to OFL buffer Y
Managed Forage Species Modified Council Risk Policy forage Can the MAFMC Develop a Forage Policy?
North Pacific Council Ecological Considerations for Forage Groundfish FMPs have a forage category as part of the ecosystem component (EC) of the fishery (8 families and 1 order); directed federal fisheries prohibited with 2% (fish on board) bycatch cap for this EC forage group M2 (predation mortality) term incorporated in stock assessments (where possible); increasing number of multi-species assessment models being developed PDTs and SSC evaluate trends in M due to predation when setting ABC for target species (may reduce ABC below max allowed if warranted) Increased biomass thresholds for commercially-important prey species to insure adequate forage for Stellar sea lions (reduced fishing as biomass thresholds are approached); Time/area restrictions to avoid local depletion Ecosystem Considerations Report appended to groundfish and crab SAFE documents Established system OY cap for BSAI (85% of sum of MSYs for managed species) and GOA groundfish fisheries (95% of sum of MSYs for managed species) Most recently developed Arctic FEP which includes system level cap=zero
PFMC Coastal Pelagics Species (CPS) FMP • Includes Pacific sardine, chub mackerel, northern anchovy, jack mackerel, market squid, and krill (euphausids) • Council banned harvest of krill in west coast EEZ (to prevent directed fishery development) in 2006 • Sardine and chub mackerel are actively managed, others are “monitored” species
PFMC: Amendment 13 (Sept 2011) to CPS FMP • Modified existing harvest control rules to include ABC buffer relative to OFL through a combination of scientific advice from SSC and a policy determination of the Council (based on Council risk tolerance) • Amendment 13 maintained default harvest control rules for monitored stocks (ABC equals 25% of OFL/MSY)
CPS Harvest Control Rules • Contain “cutoff” biomass reference points • Cut-off is defined as biomass level below which directed fishing is prohibited • Pacific sardine cutoff is 150,000 mt (or three times the overfished threshold); the control rule also contains environmental parameters to explicitly adapt harvest levels in response to environmental variability
Coastal Pelagic Species: PFMC Managed Species Control Rule • OFL = Biomass x Fmsy x Distribution • ABC = Biomass x Buffer x Fmsy x Distribution • ACL ≤ ABC General Harvest Control Rule • HG = (Biomass – Cutoff) x Fraction x Distribution • ACT = HG or ACL, whichever is less • MAXCAT also is defined The Harvest Control Rule Assures that Exploitation Rate Declines Continuously as Biomass Declines
PFMC FEP Initiative 1 • Council proceeding with development of FEP Initiative 1 – protection for un-fished forage species • Objective is to prohibit development of new directed fisheries on forage species until Council has adequate opportunity to assess the science relating to any proposed fishery and any potential impacts to existing fisheries and communities • Developed inventory of un-fished forage species and currently authorized gears and fisheries in US west coast EEZ
SSC National Workshop IV: EBFM and Forage Fish Issues • Need better ways to estimate forage biomasses • Need better ways to estimate predator demand • Determining M2 is important • Ecosystem forage buffers vs single-species buffers?
For consideration • Indicators and reference points • Are there any rules of thumb, e.g., F < M, Biomass threshold, hockey-stick (Restrepo, Lenfest) rules, appropriate F and B levels. • Can predator demand be indexed from stock assessments of predators? • What indices of ecosystem state are available that are indicative of predator demand and prey availability? • Can energetics modeling be useful to estimate demand? • What about ecosystem modeling? Strategic or tactical? • What decisions and regulations could be implemented by managers in the short term?
Leave one third for the birds Cury et al. 2011
Chesapeake Bay Integrated Biomass Size Spectrum (combined 1997 and 1999 data) Y = -1.03 X – 2.73 phytoplankton mesozooplankton Log2A (abundance) Fish larva Zooplanktivorous small fish Piscivorous large fish 2 mm 2 m 20 m 200 m 20 cm 20 mm Organism Size
Menhaden: Allocation and EBFM Bluefish Commercial Fishery Predators/Piscivores Striped Bass Weakfish Osprey What is a “Fair” Allocation Plan? Can Humans Cause “Localized Depletion?” Recreational Striped Bass Fishing