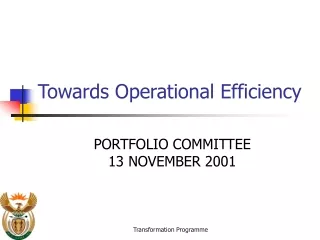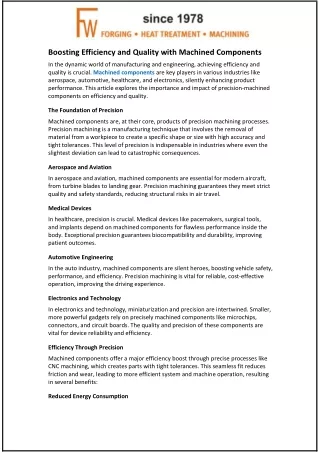
Balancing Quality Service with Operational Efficiency
260 likes | 406 Vues
Balancing Quality Service with Operational Efficiency. Judy Wright & Marv Sauer – April 19, 2011. Current Situation. Cutbacks / decreased revenue Increasing demand for services Increased regulatory requirements Increasing competition Breadth of service Complexity of service

Balancing Quality Service with Operational Efficiency
E N D
Presentation Transcript
Balancing Quality Service with Operational Efficiency Judy Wright & Marv Sauer – April 19, 2011
Current Situation • Cutbacks / decreased revenue • Increasing demand for services • Increased regulatory requirements • Increasing competition • Breadth of service • Complexity of service How do we do more with fewer or the same number of resources?
Lean Methodology • Applies specific tools and methods in a consistent manner to eliminate waste and improve operational effectiveness • Based on the Toyota Production System (TPS) - a set of manufacturing techniques to increase profits through the continuous elimination of waste
Lean Methodology • Driven by six principles • Define customer value • Identify the value stream • Make it flow • Pull it through the process • Eliminate waste • Create perfection
Process A process is any sequence of activities that satisfies a customer or business need or results in an output. It can be very simple, or extremely complex. A B C D
Process A process is any sequence of activities that satisfies a customer or business need or results in an output. It can be very simple, or extremely complex. A B C D Beginning End It has a beginning and an end
Process A process is any sequence of activities that satisfies a customer or business need or results in an output. It can be very simple, or extremely complex. A B C D End Beginning Uses inputs to produce either a product or a service as its output
Process A process is any sequence of activities that satisfies a customer or business need or results in an output. It can be very simple, or extremely complex. A A B C D End Beginning i ii iii iv v Can be broken into a series of small steps or tasks
Process Redesign Process redesign involves looking at a process and identifying areas of: A Exception report is run to identify issues B C D E F G H I J Inefficiency
Process Redesign Process redesign involves looking at a process and identifying areas of: A Exception report is run to identify issues B C D E Waste
Process Redesign Process redesign involves looking at a process and identifying areas of: A Exception report is run to identify issues B C D E B B B Duplication of Effort
Process Redesign Process redesign involves looking at a process and identifying areas of: A Exception report is run to identify issues B C D E B1 Workarounds
Process Redesign • Process Redesign Ensures: • Standardization of processes • Increases in efficiency • Incorporation of Best practices • New systems (technology) do not simply automate current processes • Technology (where used) is not driving processes, but that technology is configured to support processes
Barriers to Process Redesign • Staff who are comfortable with the “way we’ve always done it” • Staff who are uncomfortable outlining and examining how they perform their jobs • Reliance on paper-based processes (e.g. Excel spreadsheet tracking and reporting) • Resistance to change
First Law of Improvement “Every process is perfectly designed to achieve the results it achieves”
Second Law of Improvement “If you want better results, get a new process”
Why is Process (Redesign) Important? • Departments are frequently focused on “firefighting” • Many processes are designed to the “exception” rather than the “rule” • Cross-functionality provides greatest opportunity for collaborative improvement • Technology investments can be maximized when process improvements incorporate all features and functionality
Where to Start? • Identify sources of “pain”: • Manual routing of items for approval • Multiple sign-off on purchase requests • Increased time • Identify sources of “waste”: • Value added vs. non value added work • Redundancies • Duplication of effort • Use data to help prioritize and minimize • Go with your gut • Listen to the feedback provided by your stakeholders
Time Allocation • Have all members of a department fill out a time allocation matrix, e.g. technology, purchasing, financial aid • Review the FTE allocation against client satisfaction (if available) • Review performance metrics and FTE allocation against peer or industry best practices • Use process redesign as necessary to improve departmental efficiencies • Revisit after major process redesign initiatives, new technology deployment, or every 3 years (whichever comes first)
Technology Enablers • ERP System with built-in capabilities to efficiently adapt and streamline processes: • Work Flow • Employee Portal (open enrollment, paperless pay) – self service • Student Portal • Data warehousing • P-Cards • Time and Attendance • Email or electronic communications
Performance Metrics • Examples of performance metrics: • Journal Entries Adjusted • Invoice Processing • Turnaround for purchase orders • Applications processed • Calls per day per person • Cost per student • Use metrics to help to determine whether your new process is working • Adjust when necessary
Performance Management Performance Data Departmental Information
Key Ideas • Redesign processes to enhance service • Focus on value-add activities only • Know how your staff spend their time • Leverage technology • Establish measures and then track performance
Thank You For more information, contact: Marvin Sauer, Manager Plante & Moran, PLLC 248.223.3120 Marvin.Sauer@plantemoran.com Judy Wright, Partner Plante & Moran, PLLC 248.223.3304 Judy.Wright@plantemoran.com