Download
1 / 16
160 likes | 207 Vues
Explore the integration of regional knowledge into global data sets for comprehensive rice mapping in Asia. Discover the significance of accurate information for yield estimation, risk assessment, and area estimation. Learn about leveraging remote sensing data and algorithms for precise rice extent mapping. Uncover the role of temporal information in improving crop models, risk management, and market insights. Delve into the impact of climate on rice production. Dive into a discussion on refining existing crop calendars and enhancing global datasets.

E N D
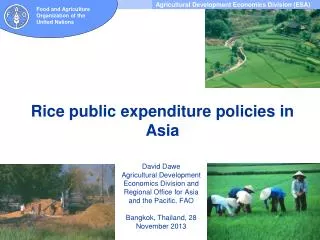
Incorporating regional knowledge into global data sets: Some ideas for rice in Asia Andy Nelson Thursday11th Sep, 2014
Do we need better data? – yes! • Regional and global modelling efforts need accurate information on the where and when of staple crops for yield and yield gap estimation, area estimations, risk/exposure assessments, etc. • Commodity research centers, like IRRI, can contribute and improve multi-commodity spatial datasets (SPAM, MIRCA2000 etc.). • Here are some ideas on how regional nodes can go beyond data-sharing to improve data on the where and when of crops.
The where of rice • Substantial literature on the use of remote sensing data to map irrigated and lowland rice. Opportunity to apply published methods to derive better information on rice extent in Asia. • Rice is a huge component of cropping systems in Asia, 144m ha. This one crop accounts for 48% of the cereal crop area in Asia. Improving information on rice will significantly improve other crop area estimates from SPAM, MIRCA etc. • We applied one algorithm (Xiao et al. 2006) to 13 years (2000-2012) of MODIS data for Asia. 44 tiles x 13 years x 46 tiles/yr and used this to estimate rice extent on a10km x 10km grid.
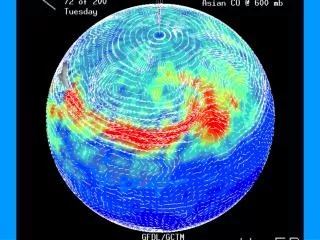
Automated paddy mapping algorithm Irrigated and lowland rainfed rice has a distinctive temporal signature that can indentified using various indices (vegetation and water indices) derived from RS data like MODIS. Rice paddies are generally flooded at the start of the season and rice biomass increases rapidly after seeding or transplanting. A simple rule is applied. IF the value of the water index (LSWI) is greater than either of the two vegetation indices (NDVI or EVI) and IF that is quickly followed by a rapid increase in NDVI then the pixel is labeled as rice. Xiao, X.; Boles, S.; Frolking, S.; Li, C.; Babu, J. Y.; Salas, W.; Moore, B. Mapping paddy rice agriculture in South and Southeast Asia using multi-temporal MODIS images. Remote Sens. Environ.2006, 100, 95–113.
Automated paddy mapping algorithm Xiao, X.; Boles, S.; Frolking, S.; Li, C.; Babu, J. Y.; Salas, W.; Moore, B. Mapping paddy rice agriculture in South and Southeast Asia using multi-temporal MODIS images. Remote Sens. Environ.2006, 100, 95–113.
Rice area in Asia from SPAM green: rice dominates the cropped area / gray: some rice in the cropped area 3.1 The where of rice In general the SPAM map has the right spatial pattern but the distribution is too diffuse. There is rice in areas where there is no rice and not enough rice in the ‘rice bowls’
Rice area in Asia from IRRI green: rice dominates the cropped area / gray: some rice in the cropped area 3.1 The where of rice IRRI map shows that the spatial distribution of rice is more focused, dramatically reducing low density rice areas and highlighting the main rice producing areas.
Rice area in Asia from IRRI green: rice dominates the cropped area / gray: some rice in the cropped area 3.1 The where of rice ? Still some issues to address. Is there that much rice in NW China? Papua, probably wetland, and not rice? Missing rice areas in Sumatra? What is the effect of using this in SPAM? ? ?
The when of rice • I believe that not enough importance is placed on temporal information in cropping systems. It is essential for initializing crop models for yield estimates and climate stress impacts. It is essential for risk management and mitigation. It leads to better rice market information. It also contributes to the improvement of global datasets on cropped area. • Again, regional nodes are best placed to improve existing crop calendars. • In this case, IRRI coordinated an effort across GRiSP partners to collect sub-national crop calendars for all rice growing countries and seasons in the world. Around 2,100 spatial units, a 10 fold increase over previous calendars.
Jan Feb Mar Apr May Junjul Aug Sep Oct Nov Dec 162m ha of rice, 113m in the main season, 44m in the second season, 5m in the third season
The when of rice – production by month 90% of production is in Asia (667mt) Over 50% occurs in just three months Africa and LAC increasing rapidly
The when of rice – area by month • IRRI calendar has more rice concentrated in the wet season and much less in the dry season • Again, this new dataset shows less diffuse patterns in rice
The when of rice – climate impacts. Rice area under cultivation (M ha) per month Asia Others Tropical storm frequency (1959 - 2011) 120 6 100 5 80 4 60 3 40 2 20 1 0 0 Jan Feb Mar Apr May Jun Jul Aug Sep Oct Nov Dec Preliminary rice crop calendar developed by GRiSP. Storm frequency from Joint Typhoon Warning Center (2011). 2011 Annual Tropical Cyclone Report: Western Pacific (Report). United States Navy, United States Air Force.
Key Messages • When is as least as important as where, but where gets most of the attention. • Regional nodes are more than just data providers, they give GEOSHARE access to a bigger network and they can lead on new ways to integrate data. • How to get these data into Workflows? • Fusing these data in an elegant and repeatable way will need some further work GEOSHARE Scientific Committee (GSC) • Can GEOSHARE do more to demonstrate best practice in data sharing in regions where data is still closed? GSC
Thank you Andy Nelson a.nelson@irri.org