Download
1 / 67
670 likes | 843 Vues
The Impact of Asian Emissions on Local/Regional/Global Air Quality. Gregory R. Carmichael Department of Chemical & Biochemical Engineering Center for Global & Regional Environmental Research and the University of Iowa CIT Seminar Jan. 2001. Air Quality Engineering: A Focus on Asia.

E N D
The Impact of Asian Emissions on Local/Regional/Global Air Quality Gregory R. Carmichael Department of Chemical & Biochemical Engineering Center for Global & Regional Environmental Research and the University of Iowa CIT Seminar Jan. 2001
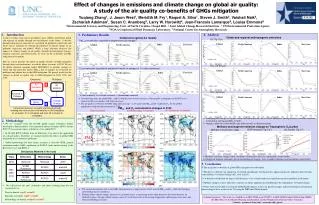
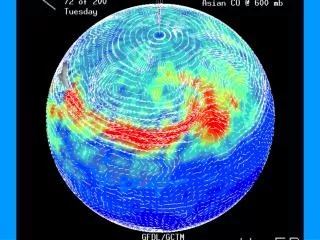
Air Quality Engineering: A Focus on Asia SO2 Emissions --China’s energy needs are projected to continue to grow at substantial rates, and with a continued reliance on coal – Sulfur emissions may follow the same trend Local to Global Impacts
Motivating Questions • What are the current and projected trends in energy and emissions? • How are these impacting human health? Food security?, etc. • What are the transboundary impacts of Asian emissions within Asia ? • What are the region-specific science issues that need to be addressed (e.g., aerosol interactions)? • What are present and future impacts of Asian emissions on global air quality? on US air quality? • To what extent are air pollution and climate change issues linked? And how can these be exploited? • What cost-effective options are available to address these concerns?
We develop and Use a Variety of Chemical Transport Models: • Global (GFDL, Chip Levy) • Regional (STEM) • Integrated Assessment (RAINS-Asia)
Aerosols are Pervasive Throughout Asian Environments BC from Pollution & Fires Mineral Dust
A Key Science Issue: Chemistry/Aerosol/Regional Climate Coupling Cirrus Stratus Radiative Forcing Anthropogenic Biogenic Tropospheric O3 Stratospheric input Gas-phase Tropospheric Chemistry Flux of gaseous species to clouds Generation of inorganic and organic aerosols by gas-to-particle conversion and nucleation Heterogeneous NOx/NOy chemistry Free radical Scavenging ? Alteration of Actinic flux Tropospheric Clouds Cloud processing Tropospheric Aerosols CCN NH3 Sea salt Mineral dust Biomass burning particles Sulfates (via gas-phase chemistry) Carbonaceous particles Alteration of cloud albedo (indirect effect) Direct effect Radiative Forcing modified after J.H.Seinfeld 1999
C Mass Transfer Coefficient Lifetime
Scheme for Aldol Condensation Reaction on Oxide Particles (Al2O3, Fe2O3, TiO2, CaO, and MgO) Li et al., JGR, in press, 2001 Saturated Carbonyl Higher Molecular Weight Unsaturated Carbonyl Impacts on RO2? On Organic aerosol mass?, others?
Summary of Combined Laboratory and Modeling Study • Spectroscopic probes of gas-phase and adsorbed species along with kinetic measurements provide the necessary information to evaluate reactions of potential importance in the troposphere • reaction mechanisms, surface coverage, saturation • uptake coefficients • Diffusion of gases into powdered samples can have a very significant effect on the measured uptake coefficient for powdered samples • multiple collisions amplify the observed uptake coefficient • Atmospheric implications of uptake measurements determined from box-model analysis • heterogeneous pathways are competitive with other carbonyl loss mechanisms (e.g. reaction with OH radical)
Three-Dimensional Combined Transport/Chemistry Analysis (STEM-III)
Model is Able to Capture Many Important Observed Features Phadnis et al., J. Atmos. Chem., 36:285 (2000); Song et al., JGR, in press (2001)
Calculated Fine and Coarse Mode Aerosol Distributions in the Boundary Layer; PEM-WEST B
Calculated Fine and Coarse Mode Aerosol Distributions in the Boundary Layer; PEM-WEST B
INTERACTIONS OF SO2 WITH MINERAL AEROSOL CHANGE SULFATE SIZE DISTRIBUTION AS WELL AS THE CHEMICAL LIFETIMES OF SULFUR. THESE INTERACTIONS HAVE IMPLICATIONS FOR RADIATIVE FORCING Song et al., JGR in press
Calculated Fine and Coarse Mode Aerosol Distributions at 5 km; PEM-WEST B
Calculated Fine and Coarse Mode Aerosol Distributions at 5 km; PEM-WEST B
The Presence of Mineral Aerosol Alters the Partitioning of Nitric Acid Song et al. J.Atmos. Chem., in press
Impact of Aerosols on the Photochemical Oxidant Cycle Through Photolysis Rates O O 2 3 HO HO 2 NO RO RO 3 2 N O HO 2 2 5 O Emission O 2 NO 3 H O 2 HNO HO 3 CH COO NO HO HO 3 2 2 2 Season Aerosol D D D D TSP Sulfate Soot Mineral CH COO 3 2 % % % % impact on O3 + \ \ \ \ n h n h h n 48.6 58.7 Winter - 18.9 13.2 -8.6 -25.8 -5.8 -33.0 Mean 1.3 + \ \ \ NO 2 Spring - 13.1 24.4 9.7 36.8 -3.7 -11.1 -3.2 -16.8 Mean 1.5 + \ \ \ 25.4 37.6 Summer - 13.7 8.3 -4.0 -12.9 -3.0 -19.1 Mean + \ \ \ \ Fall - 15.5 27.3 9.2 40.3 -20.6 -6.1 -13.5 -3.8 Mean 3 3 Dust Impact on O3 Mineral Optical Depth NOx NMHC O3 HOx UVB % Change %Change NO2 Photolysis Ozone variations (%) due to dust
Nitric Acid Reactions with Calcium Carbonate are not Limited to the Surface, and Change the Water Uptake Properties and Particle Morphology Goodman et al., JGR, 105:29053, 2000
April 1998 Asian Dust Event Courtesy of Rudolf Husar, Washington University, St. Louis: http://capita.wustl.edu/Asia-FarEast/
The Changing Air Quality of the Northern Hemisphere Pacific Basin • Pressures are from the Pacific Rim Countries and beyond. • Changing patterns and growth rates of energy use and resulting emissions are the primary forcing factors -- with East and West following different paths. • Impacts are local, regional (East and West), basin - wide, and global. • Complexities in transport and chemistry over the Pacific greatly challenge present modeling and measurement efforts.
Contribution of Fossil Fuel Burning to Tropospheric Ozone Yienger, et al, JGR 2000
ACE-Asia (NSF) & TRACE-P (NASA) Spring 2001 Experiments NASA/GTE DC-8
Reaction Gas-phase Aqua-phase aerosol Deposition Dry Wet BoundaryCond. Met Data Global analysis Vegetation・SST Transport 3D advection Vertical Dif. Precipitation Emission Data Regional Chemical Weather Forecasting System Reg. Met. Model + CTM Development and Application of Chemical Weather Forecasting System over East Asia Itsushi Uno (RIAM/Kyushu-U), Gregory R. Carmichael (UI/CGRER) We are developing and applying an operational chemical weather forecasting system based on 3-D on-line regional scale chemical transport model fully coupled with RAMS (Regional Atmospheric Modeling System, Pielke et al., 1992). This system consists of several important components; i) operational global forecast data set access to NCEP and JMA, ii) RAMS weather forecast for 72-96 hours based on the NCEP & JMA data as a lateral boundary condition, iii) On-line chemical transport calculation of important chemical tracers (SO2/SO4, mineral dust, black carbon and sea-salt, etc.) and iv) post-processing of “chemical weather forecast” results with 2/3-D graphics into the WWW-page. One of the main purposes of this system is to understand the regional transboundary air pollution and to schedule/design the operational field monitoring campaign during the ACE(Aerosol Characterization Experiment)-Asia and Trace-P intensive observations. Weather Map Chemical Weather Map
Sounding height Flight path obs. point Application & Model Validation • ACE-Asia & TRACE-P Field Campaign Planning • Field Observation Design • Traffic (Aviation) • Visibility • Environmental Assessment • Model Validation for Episodic Application • Yellow Sand (Kosa) April 1998 & March 2000 • SO2/SO4 climate simulation Simulated Kosa Onset April 98 Annual averaged Surface level SO42-
Observation at Osaka and Model Results Observed sulfate concentration at Osaka compared with model results show a good agreement, and the intermittency during the winter season and the periodicity typical of spring/fall rainy seasons, when the alternance of high/low pressure systems characterize the meteorology of the region, is nicely reproduced by the numerical model (RAMS on-line transport model). Slow & Periodical Winter & early Spring High freq. & intermittent Typhoon SO42- (mg/m3) Model Obs Modeled twelve hours averaged concentration (straight line) and daily averaged observation (dot line)
Tracer Species (2) Megacities plume Sea Salt 12 bin Sea Salt from Gong et al. Production rate depends on wind speed Several useful atmospheric tracer to Understand the origin of air mass Volcano Origin Tracer (SO2) Tracers/Markers: SO2/Sulfate DMS BC OC Volcanic Megacities CO fossil CO-Biomass Ethane Ethene Sea Salt Radon Lightning NOx Dust 12 size bins ▲ ▲ ▲ ▲ Sakurajima ▲
Front line Rain Rainy Meso Frontdevides air mass SO4 Pacifc Ocean
Frontal Outflow is the Key Transport Mechanism and needs to be Better Quantified
Tokyo & Tsukuba (observation and model results) National Inst. Env. Studies Compact Mie Lidar Extinction Coef. (km-1) SPM (Observation and Model)at Tokyo 0.2 0.02 Model (Dust and Potential Temp) Elevated dust layer comes first and then dense dust layer appears in PBL (below 2km) associated with the movement of low-pressure system z ( m ) Conc unit log(mg/m3)
Comparison of Predicted Dust and BC Distribution to Satellite Information April 21 TOMS-IA (Color shading) Dust Isosurface (Yellow) BC Isosurface (Orange) Precipitation (Contours) POES (dust) TOMS AI over laid Dust (Yellow Sand) and BC TOMS AI and Precip