Download
1 / 70
700 likes | 819 Vues
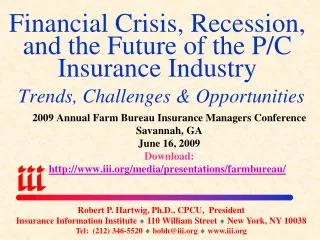
Financial Crisis, Economic Stimulus & the Future of the P/C Insurance Industry Trends, Challenges & Opportunities. Independent Insurance Agents of Westchester County Education Day Tarrytown, NY http://www.iii.org/media/presentations/westchester/ March 11, 2009.

E N D
Financial Crisis, Economic Stimulus & the Future of the P/C Insurance Industry Trends, Challenges & Opportunities Independent Insurance Agents of Westchester County Education Day Tarrytown, NY http://www.iii.org/media/presentations/westchester/ March 11, 2009 Robert P. Hartwig, Ph.D., CPCU, President Insurance Information Institute 110 William Street New York, NY 10038 Tel: (212) 346-5520 bobh@iii.org www.iii.org
THE ECONOMIC STORMWhat a Weakening Economy and Financial Crisis Mean for the Insurance IndustryExposure & Claim Cost Effects
Real GDP Growth* Recession began in December 2007. Economic toll of credit crunch, housing slump, labor market contraction is growing The Q4:2008 decline was the steepest since the Q1:1982 drop of 6.4% *Yellow bars are Estimates/Forecasts from Blue Chip Economic Indicators. Source: US Department of Commerce, Blue Economic Indicators 2/09; Insurance Information Institute.
Real GDP Growth vs. Real P/C Premium Growth: Modest Association P/C insurance industry’s growth is influenced modestly by growth in the overall economy Sources: A.M. Best, US Bureau of Economic Analysis, Blue Chip Economic Indicators, 2/09; Insurance Information Inst.
Length of US Recessions,1929-Present* Months in Duration Current recession began in Dec. 2007 and is already the longest since 1981. If it extends beyond April, it will become the longest recession since the Great Depression. “We will rebuild. We will recover.” --President Barack Obama addressing a joint session of Congress February 24, 2009 * As of March 2009 Sources: National Bureau of Economic Research; Insurance Information Institute.
Unemployment Rate:US vs. New York State January 2000 through January 2009 NY’s unemployment rate in Jan. 2009 was 7.0% compared to 7.6% for the US. Will likely rise to 9%+. NY Trough: 4.3% in Nov./Dec. 2006 Jan-09 Source: US Bureau of Labor Statistics; Insurance Information Institute.
US Unemployment Rate:A Volatile History January 1948 through February 2009 May 1975 9.0% Nov/Dec 1982: 10.8% Jul. 1958 7.5% Aug. 1949 7.9% Feb 2009 8.1% May 1961 7.1% Jun. 1992 7.8% Sep. 1954 6.1% Aug. 1971 6.1% Jun. 2003 6.3% Source: US Bureau of Labor Statistics; Insurance Information Institute.
New Private Housing Starts,1990-2010F (Millions of Units) New home starts plunged 34% from 2005-2007; Drop through 2009 trough is 68% (est.)—a net annual decline of 1.41 million units, lowest since record began in 1959 Exposure growth forecast for HO insurers is dim for 2009 with some improvement in 2010. Impacts also for comml. insurers with construction risk exposure I.I.I. estimates that each incremental 100,000 decline in housing starts costs home insurers $87.5 million in new exposure (gross premium). The net exposure loss in 2009 vs. 2005 is estimated at about $1.2 billion. Source: US Department of Commerce; Blue Chip Economic Indicators (2/09); Insurance Information Inst.
State Construction Employment, Dec. 2007 – Dec. 2008 WA NH MT ND ME VT MN OR ID MA WI NY SD WY MI RI CT PA NV IA NE NJ OH IL UT IN DE Construction employment declined in 47 of 50 states in 2008 CO WV VA CA KS MO KY MD NC TN AZ DC OK NM AR SC AL GA MS LA AK AK TX FL HI 14 Sources: Associated General Contractors of America from Bureau of Labor Statistics; Insurance Information Institute.
State Construction Employment, Dec. 2007 – Dec. 2008 Sources: Associated General Contractors of America from Bureau of Labor Statistics; Insurance Info. Inst.
Auto/Light Truck Sales,1999-2010F (Millions of Units) Weakening economy, credit crunch are hurting auto sales; Gas prices less of a factor now. New auto/light truck sales are expected to experience a net drop of 6.0 million units annually by 2009 compared with 2005, a decline of 35.5% and the lowest level since the late 1960s Impacts of falling auto sales will have a less pronounced effect on auto insurance exposure growth than problems in the housing market will on home insurers Source: US Department of Commerce; Blue Chip Economic Indicators (2/09); Insurance Information Inst.
Total Industrial Production,(2007:Q1 to 2010:Q4F) Obama stimulus program is expected benefit impact industrial production and therefore insurance exposure both directly and indirectly Industrial production began to contract sharply during H2 2008 and is expected to shrink through the first half of 2009 Figures for 2010 revised upwards to reflect expected impact of Obama stimulus program Sources: US Bureau of Labor Statistics; Blue Chip Economic Indicators (2/09); Insurance Info. Inst.
Wage & Salary Disbursements (Payroll Base) vs. Workers Comp Net Written Premiums Wage & Salary Disbursement (Private Employment) vs. WC NWP $ Billions $ Billions 12/07-? 7/90-3/91 3/01-11/01 Weakening wage and salary growth is expected to cause a deceleration in workers comp exposure growth Shaded areas indicate recessions *9-month data for 2008 Source: US Bureau of Economic Analysis; Federal Reserve Bank of St. Louis at http://research.stlouisfed.org/fred2/series/WASCUR; I.I.I. Fact Books
THE $787 BILLION ECONOMIC STIMULUSSectoral Impacts & Implications for P/C Insurance
Summary of Short-Run Impacts of Stimulus Package on P/C Insurance • No Stimulus Provisions Specifically Address P/C Insurance • Spending, Aid and Tax Reductions benefit other industries, state and local governments, as well as individual and some corporate taxpayers • Stimulus Package is Unlikely to Increase Net Premiums Written by Less Than 1% or Approximately $4.5 Bill. by Year-End 2010 • “Direct” Impact to P/C Insurers Results Primarily from Increased Demand for Commercial Insurance • Primarily the result of increased infrastructure spending and the resulting need to insure workers, property and protect against liability risks • Because the primary objective of the stimulus is employment related, workers compensation will be the p/c line that benefits the most • Assuming the target of 3.5 million jobs created or preserved is achieved, private workers comp NPW (new and preserved) could amount to as much as $1.1 billion • Other commercial lines to benefit: surety, commercial auto, inland marine • Other “Direct” P/C Demand Benefits Will Be Minimal • Tax provisions providing incentives to buy cars and homes and accelerate the depreciation of equipment will have little net impact on exposure • Some additional premium may be generated as older cars and equipment are replaced with new and more valuable (and therefore more expensive to insure)
Economic Stimulus Package: Where the $787B Goes Less than ¼ of the stimulus package is direct spending on infrastructure How much “stimulus” is actually in the stimulus package is open to debate and dispute Sources: Wall Street Journal , 2/13/09; House Ways and Means Committee; Senate Finance Committee.
Economic Stimulus Package: Where the $787B Goes $ Billions Objective is to create or preserve 3.5 million jobs Tax relief and aid to state and local government account for 56% of stimulus. Actual spending accounts for only about 25% Source: http://www.recovery.gov/ accessed 2/18/09; Insurance Information Institute.
Economic Stimulus Package: $143.4 in Construction Spending $ Billions There is approximately $140B in new construction spending in the stimulus package, about 1/3 of it for transportation. Source: Associated General Contractors at http://www.agc.org/cs/rebuild_americas_future (2/18/09); Insurance Info. Inst..
State-by-State Infrastructure SpendingBigger States Get More, Should Benefit Commercial Insurer Exposure
Infrastructure Stimulus Spending by State (Total = $38.1B) Sources: USA Today, 2/17/09; House Transportation and Infrastructure Committee; the Associated Press.
Infrastructure Stimulus Spending By State: Top 25 States ($ Millions) Infrastructure spending is in the stimulus package total $38.1B, allocated largely by population size. NY will get $2.8B—the 3rd highest amount. Sources: USA Today 2/19/09; House Transportation and Infrastructure Committee; the Associated Press.
Expected Number of Jobs Gained or Preserved by Stimulus SpendingLarger States = More JobsWorkers Comp Benefits
Estimated Job Effect of Stimulus: Jobs Created/Saved By State = 3.5 Mill Total Sources: http://www.recovery.gov/; Council of Economic Advisers; Insurance Information Institute.
Estimated Job Effect of Stimulus Spending By State: Top 25 States (Thousands) The economic stimulus plan calls for the creation or preservation of 3.5 million jobs, allocated roughly in proportion to the size of the state’s labor force—215,000 in NY Sources: http://www.recovery.gov/; Council of Economic Advisers Insurance Information Institute.
FINANCIAL STRENGTH & RATINGSIndustry Has Weathered the Storms Well
P/C Insurer Impairment Frequency vs. Combined Ratio, 1969-2007 Impairment rates are highly correlated underwriting performance and could reached a record low in 2007 2007 impairment rate was a record low 0.12%, one-seventh the 0.8% average since 1969; Previous record was 0.24% in 1972 Source: A.M. Best; Insurance Information Institute
Summary of A.M. Best’s P/C Insurer Ratings Actions in 2008* P/C insurance is by design a resilient in business. The dual threat of financial disasters and catastrophic losses are anticipated in the industry’s risk management strategy. Despite financial market turmoil, high cat losses and a soft market in 2008, 81% of ratings actions by A.M. Best were affirmations; just 3.8% were downgrades and 4.0% upgrades *Through December 19. Source: A.M. Best.
Reasons for US P/C Insurer Impairments, 1969-2005 2003-2005 1969-2005 Deficient reserves, CAT losses are more important factors in recent years *Includes overstatement of assets. Source: A.M. Best: P/C Impairments Hit Near-Term Lows Despite Surging Hurricane Activity, Special Report,Nov. 2005;
CONSUMER POLL:2008 I.I.I. PULSE SURVEY Q. DO YOU THINK THAT THESE PROBLEMS (THE MORTGAGE PROBLEMS SOME AMERICANS FACE, THE DROP IN THE STOCK MARKET AND JOB LAYOFFS) AFFECT THE ABILITY OF INSURANCE COMPANIES TO PAY THEIR CLAIMS, TO SELL MORE INSURANCE, BOTH, NONE OF THESE (DOESN’T AFFECT ABILITY TO PAY CLAIMS OR SELL INSURANCE) OR DON’T KNOW? 95% Americans think that the downturn in the economy affects the basic business of the insurance industry: the ability to pay claims and/or sell insurance Source: Insurance Information Institute, 2008 Pulse Survey, November 2008.
Critical Differences Between P/C Insurers and BanksSuperior Risk Management Model & Low Leverage Makea Big Difference
How Insurance Industry Stability Has Benefitted Consumers • BOTTOM LINE: • Insurance Markets—Unlike Banking—Are Operating Normally • The Basic Function of Insurance—the Orderly Transfer of Risk from Client to Insurer—Continues Uninterrupted • This Means that Insurers Continue to: • Pay claims (whereas 42 banks have gone under as of 3/6) • The Promise is Being Fulfilled • Renew existing policies (banks are reducing and eliminating lines of credit) • Write new policies (banks are turning away people who want or need to borrow) • Develop new products (banks are scaling back the products they offer) Source: Insurance Information Institute
Reasons Why P/C Insurers Have Fewer Problems Than Banks: A Superior Risk Management Model • Emphasis on Underwriting • Matching of risk to price (via experience and modeling) • Limiting of potential loss exposure • Some banks sought to maximize volume and fees and disregarded risk • Strong Relationship Between Underwriting and Risk Bearing • Insurers always maintain a stake in the business they underwrite, keeping “skin in the game” at all times • Banks and investment banks package up and securitize, severing the link between risk underwriting and risk bearing, with (predictably) disastrous consequences—straightforward moral hazard problem from Econ 101 • Low Leverage • Insurers do not rely on borrowed money to underwrite insurance or pay claimsThere is no credit or liquidity crisis in the insurance industry • Conservative Investment Philosophy • High quality portfolio that is relatively less volatile and more liquid • Comprehensive Regulation of Insurance Operations • The business of insurance remained comprehensively regulated whereas a separate banking system had evolved largely outside the auspices and understanding of regulators (e.g., hedge funds, private equity, complex securitized instruments, credit derivatives—CDS’s) • Greater Transparency • Insurance companies are an open book to regulators and the public Source: Insurance Information Institute
P/C INSURANCE FINANCIAL PERFORMANCEA Resilient Industry in Challenging Times
P/C Net Income After Taxes1991-2009F ($ Millions)* • 2001 ROE = -1.2% • 2002 ROE = 2.2% • 2003 ROE = 8.9% • 2004 ROE = 9.4% • 2005 ROE= 9.4% • 2006 ROE = 12.2% • 2007 ROAS1 = 12.3% • 2008 ROAS = 1.1%* Insurer profits peaked in 2006. *ROE figures are GAAP; 1Return on avg. surplus.2008 numbers are annualized based on 9-mos. Actual of $4.066 billion. Sources: A.M. Best, ISO, Insurance Information Inst.
P/C Insurance Industry ROEs,1975 – 2010F* 1977:19.0% 1987:17.3% 2006:12.2% 1997:11.6% 10 Years 10 Years 9 Years 2009F: 4.5% 2008F: 1.1% 2010F: 6.0% 1975: 2.4% 1984: 1.8% 1992: 4.5% 2001: -1.2% Note: 2009 figure is actual 9-month result. Sources: ISO;Insurance Information Institute.
Presidential Politics & P/C InsuranceHow is Profitability Affected by the President’s Political Party?
P/C Insurance Industry ROE byPresidential Administration,1950-2008* OVERALL RECORD: 1950-2008* Democrats 8.05% Republicans 8.02% Party of President has marginal bearing on profitability of P/C insurance industry *ROE for 2008 based on H1 data. Truman administration ROE of 6.97% based on 3 years only, 1950-52. Source: Insurance Information Institute
P/C Premium GrowthPrimarily Driven by the Industry’s Underwriting Cycle, Not the Economy
Strength of Recent Hard Marketsby NWP Growth 1975-78 1984-87 2000-03 Shaded areas denote “hard market” periods Net written premiums fell 1.0% in 2007 (first decline since 1943) and by 0.4% in 2008, the first back-to-back decline since 1930-33 64 Sources: A.M. Best (historical and forecast), ISO, Insurance Information Institute
Personal/Commercial Lines & Reinsurance NPW Growth,2006-2009F Declines in premium growth began to stabilize in later 2008 and are firming to some extent as we move into 2009, but are partly offset by flat/declining exposures due to the recession Sources: A.M. Best Review & Preview, Feb. 2009
Capital/Policyholder SurplusShrinkage, but Capital is Within Historic Norms
U.S. Policyholder Surplus: 1975-2008* Actual capacity as of 9/30/08 was $478.5, down 7.6% from 12/31/07 at $517.9B, but 68% above its 2002 trough. Recent peak was $521.8 as of 9/30/07. Estimate as of 12/31/08 is $438B is 16% below 2007 peak. $ Billions The premium-to-surplus ratio stood at $0.94:$1 at year end 2008, up from near record low of $0.85:$1 at year-end 2007 “Surplus” is a measure of underwriting capacity. It is analogous to “Owners Equity” or “Net Worth” in non-insurance organizations Source: A.M. Best, ISO, Insurance Information Institute. *Towers Perrin estimate as of 12/31/08
Policyholder Surplus, 2006:Q4 – 2008:Q4(Est.) Capacity peaked at $521.8 as of 9/30/07 Declines Since 2007:Q3 Peak Q2: -$16.6B (-3.2%) Q3E: -$43.3B (-8.3%) Q4E: -$84B (-16.1%) Source: ISO (historical); Towers Perrin (Oct. 21) estimates for Q4 2008. Q4 assumes no major Investment market recovery before year-end 2008.
Historically, Hard Markets Follow When Surplus “Growth” is Negative Sharp decline in capacity is a necessary but not sufficient condition for a true hard market *Actual 9-month 2008 result. Sources: A.M. Best, ISO, Insurance Information Institute
Investment Performance Investments are the Principle Source of Declining Profitability
Distribution of P/C Insurance Industry’s Investment Portfolio As of December 31, 2007 Portfolio Facts • Invested assets totaled $1.3 trillion as of 12/31/07 • Insurers are generally conservatively invested, with 2/3 of assets invested in bonds as of 12/31/07 • Only about 18% of assets were invested in common stock as of 12/31/07 • Even the most conservative of portfolios was hit hard in 2008 Source: NAIC; Insurance Information Institute research;.
Property/Casualty Insurance Industry Investment Gain:1994- 2008:Q3 1 Investment gains are off sharply in 2008 due to lower yields and poor equity market conditions. 1Investment gains consist primarily of interest, stock dividends and realized capital gains and losses. 2006 figure consists of $52.3B net investment income and $3.4B realized investment gain. *2005 figure includes special one-time dividend of $3.2B. Sources: ISO; Insurance Information Institute.
Underwriting TrendsFinancial Crisis Does Not Directly Impact Underwriting Performance: Cycle, Catastrophes Were 2008’s Drivers
P/C Insurance Combined Ratio, 1970-2008F* Combined Ratios 1970s: 100.3 1980s: 109.2 1990s: 107.8 2000s: 102.0* Sources: A.M. Best; ISO, III *A.M. Best year end estimate of 103.2; Actual 9-mos. result was 105.6.