Download
1 / 20
230 likes | 640 Vues
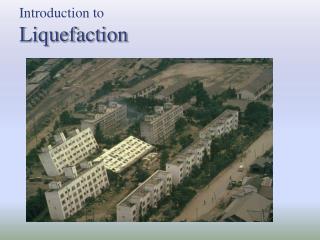
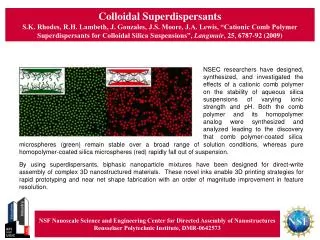
Liquefaction Mitigation with Colloidal Silica. Carolyn Conlee Advisor: Patricia M. Gallagher Co-advisor: Ross Boulanger. Purpose of This test. To evaluate the effectiveness of colloidal silica grout for liquefaction remediation →NEES GRAND CHALLENGE

E N D
Liquefaction Mitigationwith Colloidal Silica Carolyn Conlee Advisor: Patricia M. Gallagher Co-advisor: Ross Boulanger
Purpose of This test To evaluate the effectiveness of colloidal silica grout for liquefaction remediation →NEES GRAND CHALLENGE This centrifuge tests will complement both the centrifuge drain test and separate field experiments performed by UT Austin
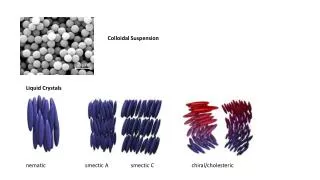
Colloidal Silica • nontoxic, biologically and chemically inert (Iler, 1979) • Low, initial viscosity with controllable gel times (Gallagher, 2000) • excellent durability characteristics (Whang, 1995) • Strength gain for up to 1 yr (Persoff et al., 1999) • Majority of strength gain = RESONANT TIME = 10*initial gel time (Gallagher 2000)
Colloidal Silica • Gel times vary from minutes to months (Noll et al,1993) • Controllable by: (1) Silica Concentration (2)Ionic Strength (NaCl, NH4Cl) (3) pH of solution (DuPont, 1996)
Laboratory Testing of Colloidal Silica Performance • Monterey sand treated with colloidal silica (5 to 10 wt%) increases the deformation resistance tested in cyclic triaxial shear (Gallagher and Mitchell, 2002) Failure @ 13 Cycles liquefaction 2% Strain after 40 cycles 5% Strain after 40 cycles
Liquefiable layer surrounding pile caps treated with 6 wt % colloidal silica (Pamuk et al, 2006) 50 g test acceleration; sinusoidal input motion (prototype: .25 g, 2 Hz) Significant liquefaction Resistance: Reduced deformation in free field (71 vs. 3.4 cm) reduced imposed moments on piles (220 vs. 10 kN-m) reduced permanent ground deformation by 95% Centrifuge Testing of Colloidal Silica Performance Free-field lateral displacement
Research Objectives RESEARCH OBJECTIVES: 1. Quantify soil behavior after treatment (accelerations, displacements, pore pressure response) during and after shaking 2. Determine if improvement due to the treatment can be measured using conventional geotechnical/geophysical methods (i.e. shear wave velocity, CPT) 3. Adequately characterize stress-strain behavior of treated soil for future use in numerical models 4. Compare/contrast response of soil using colloidal silica to earthquake drain
MODEL GEOMETRY TREATED AREA W. COLLOIDAL SILICA UNTREATED AREA
INSTRUMENTATION • CPT in treated zone: 1g→4g→1g→15g • CPT in untreated zone: 1g and 15g
Data Reduction and Analysis In general: • Want to compare the response of treated and untreated areas • Study the response of colloidal silica and earthquake drain improvement mechanisms • Provide parameters for numerical models • Accelerometers: calculate stresses and strains in liquefiable and top crust layers
Data Reduction and Analysis • Accelerometers and LVDTs: determine progression/extent of lateral spreading and settlement in crust and liquefiable layer • Pore pressure transducers: calculate excess pore water pressures → characterize extent of liquefaction as a function of time • Benders: compare shear wave velocities for improved and unimproved areas • Surface Markers: determine surface displacements due to lateral spreading
UNRESOLVED ISSUES • Saturation Method (treqd≈4hr) - Target initial gel time = 8 hr→Resonates in 80 hr • Monitoring coverage of colloidal silica in liquefiable layer after saturation but befor shaking (P-wave tests?) • Quantifying improvement with conventional geotechnical methods (e.g. CPT, Vs) • Reaction of CO2 w/ Colloidal silica • Impermeable Barrier (Flexible but water-tight)
SATURATION TESTS • Grouting Tubes for 2D Flow; Reduce Drainage Path • (time = drainage path2) →13.7 mm vs. 1325 mm • Issue:non-uniform coverage
SATURATION TESTS • Flow appears to stop at about 25 cm of head • Capillary Rise of at least 20 cm for each case was observed • Greatest concern is large gradients: sand boiling
Treated (1 mo. later) Treated (7 mo. later) Untreated (7 mo. later) Untreated (1 mo. later) Treatment Area Quantifying Treatment using Conventional Geotechnical/Geophysical Methods • Full scale-field test showed 30% reduction in surface settlement • No correlation between treatment and CPT data
Quantifying Treatment using Conventional Geotechnical/Geophysical Methods Big questions: • Where did it go and did it saturate soil? • Has it been there long enough? • Can the improved soil be correlated to CPT and/or shear wave velocity data? • Test: (i) Bender Element Arrays for Vs (ii)CPT (iii) Other geotechnical/geophysical methods?