Download

1 / 48
480 likes | 731 Vues
Association Analysis-based Extraction of Functional Information from Protein-Protein Interaction Data. Vipin Kumar University of Minnesota kumar@cs.umn.edu www.cs.umn.edu/~kumar Team Members: Michael Steinbach, Rohit Gupta, Hui Xiong, Gaurav Pandey, Tushar Garg

E N D
Association Analysis-based Extraction of Functional Information fromProtein-Protein Interaction Data Vipin Kumar University of Minnesota kumar@cs.umn.edu www.cs.umn.edu/~kumar Team Members: Michael Steinbach, Rohit Gupta, Hui Xiong, Gaurav Pandey, Tushar Garg Collaborators: Chris Ding, Xiaofeng He, Ya Zhang, Stephen R. Holbrook Research supported by NSF, IBM
Protein Function and Interaction Data • Proteins usually interact with other proteins to perform their function(s) • Interaction data provides a glimpse into the mechanisms underlying biological processes • Networks of pairwise protein-protein interactions • Protein complexes • Neighboring proteins in an interaction network tend to perform similar functions • Several computational approaches proposed for predicting protein function from interaction networks [Pandey et al, 2006] • A group of proteins occurring in many complexes may represent a functional modules that consists of proteins involved in similar biological processes
Problems with Available Interaction Data (I) • Noise: Spurious or false positive interactions • Leads to significant fall in performance of protein function prediction algorithms [Deng et al, 2003] Hart et al,2006
Problems with Available Interaction Data (II) • Incompleteness: Unavailability of a major fraction of interactomes of major organisms • Yeast: 50%, Human: 11% • May delay the discovery of important knowledge Hart et al, 2006
Overview This talk is about using association analysis to address these limitations of protein interaction data
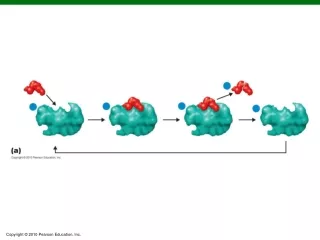
Association Analysis Set-Based Representation of Data • Association analysis: Analyzes relationships among items (attributes) in a binary transaction data • Example data: market basket data • Applications in business and science • Marketing and Sales Promotion • Identification of functional modules from protein complexes • Noise removal from protein interaction data • Two types of patterns • Itemsets:Collection of items • Example: {Milk, Diaper} • Association Rules:XY, where X and Y are itemsets. • Example: Milk Diaper
Association Analysis • Process of finding interesting patterns: • Find frequent itemsets using a support threshold • Find association rules for frequent itemsets • Sort association rules according to confidence • Support filtering is necessary • To eliminate spurious patterns • To avoid exponential search - Support has anti-monotone property:XY implies (Y) ≤ (X) • Confidence is used because of its interpretation as conditional probability • Has well-known limitations Given d items, there are 2d possible candidate itemsets
The H-confidence Measure • The h-confidence of a pattern P = {i1, i2,…, im} • Illustration: • A pattern P is a hyperclique pattern if hconf(P)>=hc, where hc is a user specified minimum h-confidence threshold
Alternate Equivalent Definitions of h-confidence • Given a pattern P = {i1, i2,…, im} • Definition: • Definition: All-Confidence Measure Omiecinski – TKDE 2003
Anti-monotone • High Affinity Property • High h-confidence implies tight coupling amongst all items in the pattern • Magnitude of relationship consistent with many other measures • Jaccard, Correlation, Cosine • Cross support property • Eliminates patterns involving items that have very different support levels Properties of Hyperclique Pattern
Given a Pattern P = {i1, i2,…, im} • For any two Itemsets hconf(P) Cross Support Property of h-confidence • At high support, all patterns that involve low support items are eliminated • At low support, too many spurious patterns are generated that involve one high support item and one low support item Support distribution of the pumsb dataset
Applications of H-confidence/Hypercliques • Pattern-preserving clustering [Xiong et al, 2004, SDM] • Reducing privacy leakage in databases [Xiong et al, 2006c, VLDB Journal] • Noise removal [Xiong et al, 2006b, IEEE TKDE] • Data points not a member of any hypercliques hypothesized to be noisy • Improved performance of several data analysis tasks (association analysis, clustering) on several types of data sets (text, microarray data) • Illustrates noise resistance property of hypercliques and h-confidence • Discovery of functional modules from protein complexes [Xiong et al, 2005, PSB] • Noise-resistant transformation of protein interaction networks [Pandey et al, 2007, KDD]
I. Application of Association Analysis: Identification of Protein Function Modules • Published in Xiong et al [2005], PSB • The TAP-MS dataset by Gavin et al 2002: Tandem affinity purification (TAP) – mass spectrometry (MS) • Contains 232 multi-protein complexes formed using 1361 proteins • Number of proteins per complex range from 2 to 83 (average 12 components) • Hyperclique derived from this data can be used to discover frequently occurring groups of proteins in several complexes • Likely to constitute functional modules
Functional Group Verification Using Gene Ontology • Hypothesis: Proteins within the same pattern are more likely to perform the same function and participate in the same biological process • Gene Ontology • Three separate ontologies: Biological Process, Molecular Function, Cellular Component • Organized as a DAG describing gene products (proteins and functional RNA) • Collaborative effort between major genome databases http://www.geneontology.org
Hyperclique Patterns from Protein Complex Data • List of maximal hyperclique patterns at a support threshold 2 and an h-confidence threshold 60%. [1] Xiong et al. (Detailed results are at http://cimic.rutgers.edu/~hui/pfm/pfm.html) 6 Dim1 Ltv1 YOR056C YOR145C Enp1 YDL060W 6 Luc7 Rse1 Smd3 Snp1 Snu71 Smd2 6 Pre3 Pre2 Pre4 Pre5 Pre8 Pup3 7 Clf1 Lea1 Rse1 YLR424W Prp46 Smd2 Snu114 7 Pre1 Pre7 Pre2 Pre4 Pre5 Pre8 Pup3 7 Blm3 Pre10 Pre2 Pre4 Pre5 Pre8 Pup3 8 Clf1 Prp4 Smb1 Snu66 YLR424W Prp46 Smd2 Snu114 8 Pre2 Pre4 Pre5 Pre8 Pup3 Pre6 Pre9 Scl1 10 Cdc33 Dib1 Lsm4 Prp31 Prp6 Clf1 Prp4 Smb1 Snu66 YLR424W 12 Dib1 Lsm4 Prp31 Prp6 Clf1 Prp4 Smb1 Snu66 YLR424W Prp46 Smd2 Snu114 12 Emg1 Imp3 Imp4 Kre31 Mpp10 Nop14 Sof1 YMR093W YPR144C Krr1 YDR449C Enp1 13 Ecm2 Hsh155 Prp19 Prp21 Snt309 YDL209C Clf1 Lea1 Rse1 YLR424W Prp46 Smd2 Snu114 13 Brr1 Mud1 Prp39 Prp40 Prp42 Smd1 Snu56 Luc7 Rse1 Smd3 Snp1 Snu71 Smd2 39 Cus1 Msl1 Prp3 Prp9 Sme1 Smx2 Smx3 Yhc1 YJR084W Brr1 Dib1 Ecm2 Hsh155 Lsm4 Mud1 Prp11 Prp19 Prp21 Prp31 Prp39 Prp40 Prp42 Prp6 Smd1 Snt309 Snu56 Srb2 YDL209C Clf1 Lea1 Luc7 Prp4 Rse1 Smb1 Smd3 Snp1 Snu66 Snu71 YLR424W 3 Kre35 Nog1 YGR103W 3 Krr1 Cbf5 Kre33 3 Nab3 Nrd1 YML117W 3 Nog1 YGR103W YER006W 3 Bms1 Sik1 Rpp2b 3 Rpn10 Rpt3 Rpt6 3 Rpn11 Rpn12 Rpn8 3 Rpn12 Rpn8 Rpn10 3 Rpn9 Rpt3 Rpt5 3 Rpn9 Rpt3 Rpt6 3 Brx1 Sik1 YOR206W 3 Sik1 Kre33 YJL109C 3 Taf145 Taf90 Taf60 4 Fyv14 Krr1 Sik1 YLR409C 4 Mrpl35 Mrpl8 YML025C Mrpl3 4 Rpn12 Rpn8 Rpt3 Rpt6 5 Rpn6 Rpt2 Rpn12 Rpn3 Rpn8 5 Ada2 Gcn5 Rpo21 Spt7 Taf60 6 YLR033W Ioc3 Npl6 Rsc2 Itc1 Rpc40 2 Tif4632 Tif4631 2 Cdc33 Snp1 2 YHR020W Mir1 2 Cka1 Ckb1 2 Ckb2 Cka2 2 Cop1 Sec27 2 Erb1 YER006W 2 Ilv1 YGL245W 2 Ilv1 Sec27 2 Ioc3 Rsc8 2 Isw2 Itc1 2 Kre33 YJL109C 2 Kre33 YPL012W 2 Mot1 Isw1 2 Npl3 Smd3 2 Npl6 Isw2 2 Npl6 Mot1 2 Rad52 Rfa1 2 Rpc40 Rsc8 2 Rrp4 Dis3 2 Rrp40 Rrp46 2 Cbf5 Kre33 3 YGL128C Clf1 YLR424W 3 Cka2 Cka1 Ckb1 3 Has1 Nop12 Sik1 3 Hrr25 Enp1 YDL060W 3 Hrr25 Swi3 Snf2
Summary • Number of hypercliques: • Size-2: 22, Size-3: 18, Size-4: 3, Size-5: 2 • Size-6: 4, Size-7: 3, Size-8: 2, Size-10: 1 • Size-12: 2, Size-13: 2, Size-39: 1 • In most cases, proteins identified as hypercliques found to be functionally coherent and part of same biological process evaluated using GO hierarchies
Function Annotation for Hyperclique {PRE2 PRE4 PRE5 PRE6 PRE8 PRE9 PUP3 SCL1} • GO hierarchy shows that the identified proteins in hyperclique perform the same function and involved in same biological process
# distinct proteins in cluster = 13 # proteins in one group = 12 (rest denoted as ) # distinct proteins in cluster = 13 # proteins in one group = 10 (rest denoted as ) More Hyperclique Examples
More Hyperclique Examples.. # distinct proteins in cluster = 12 # proteins in one group = 12 # distinct proteins in cluster = 8 # proteins in one group = 8
More Hyperclique Examples.. # distinct proteins in cluster = 12 # proteins in one group = 12
# distinct proteins in cluster = 10 # proteins in one group = 9 (rest denoted as ) More Hyperclique Examples..
More Hyperclique Examples.. • Only two Proteins SRB2 and ECM2 involved in cellular process and development got clustered together with group of proteins involved in physiological process • It is observed that 37 proteins out of 39 annotated proteins are responsible for same molecular function, mRNA splicing via spliceosome # distinct proteins in cluster = 39 # proteins in one group = 32 # proteins at node ‘mRNA splicing’ = 37
Functional Annotation of Uncharacterized Proteins • Hyeperclique Pattern: {Emg1 Imp3 Imp4 Kre31 Mpp10 Nop14 Sof1 YMR093W YPR144C Krr1 YDR449C Enp1} • 8 of the 12 proteins have annotation of “RNA binding” • Other 4 proteins have no functional annotation • Hypothesis: Unannotated proteins have same molecular function “RNA binding”, since hypercliques tend to have proteins that are functionally coherent
Identification of Functional Modules Using Frequent Itemset-based Approach • Closed frequent itemset-based approach produces over 500 patterns of size 2 or more with support threshold of 2 • Number of patterns • for (h-confidence < 0.20) = 198 • Generally very poor • for (0.20 <= h-confidence < 0.50) = 246 • moderate quality • for (h-confidence >= 0.50) = 65 • Generally very good • Proteins in large size patterns (with high h-confidence) are found to be better functionally related than even proteins in small size patterns (with less h-confidence)
Clustering of Protein Complex Data • Clustering software CLUTO (http://glaros.dtc.umn.edu/gkhome/views/cluto) is used to cluster the proteins in groups • Repeated bisection method is used as the base method for clustering • Cosine similarity measure is used to find similarity between proteins • Parameter to define the maximum number of clusters that could be obtained is set to 100 • Best clusters (as measured by internal similarity) are usually the candidates for functional modules
Clustering Results Summary • Clusters with high internal similarity (as ranked by Cluto program) and relatively small sizes are found to be functionally coherent using GO hierarchies • It is found that large clusters with relatively low internal similarity have proteins with multiple function annotations • Few examples to illustrate this are shown
Clustering Results – GO Hierarchies # distinct proteins in cluster = 6 # proteins in one group = 6 # distinct proteins in cluster = 5 # proteins in one group = 5
Proteins MNN10 and ANP1 (denoted by ) involved in metabolism got clustered together with group of proteins involved in physiological process # distinct proteins in cluster = 6 # proteins in one group = 4 Clustering Results – GO Hierarchies
Protein SKN1 (denoted by ) involved in metabolism got clustered together with proteins involved in cellular physiological process # distinct proteins in cluster = 11 # proteins in one group = 10 Clustering Results – GO Hierarchies
# distinct proteins in cluster = 7 # proteins in one group = 4 (Rest of the 3 proteins are marked as ) Clustering Results – GO Hierarchies
Protein AAP1 and VAM6 (denoted by ) got clustered together with group of proteins involved in biological process of membrane fusion # distinct proteins in cluster = 8 # proteins in one group = 4 (rest denoted by ) Clustering Results – GO Hierarchies
Summary of Results • Hypercliques show great promise for identifying protein modules and for annotating uncharacterized proteins • Clustering does not perform as well as hypercliques due to a variety of reasons: • Each protein gets assigned to some cluster even if there is no right cluster for it • Modules can be overlapping • Modules can be of different sizes • Data is high-dimensional
Application II: Association Analysis-based Pre-processing of Protein Interaction Networks • Overall Objective: Accurate inference of protein function from interaction networks • Complexity: Noise and incompleteness in interaction networks adversely impact accuracy of functional inferences [Deng et al, 2003] • Potential Approach: Pre-processing of interaction networks
Our Approach • Transform graph G=(V,E,W) into G’=(V,E’,W’) • Tries to meet three objectives: • Addition of potentially biologically valid edges • Removal of potentially noisy edges • Assignment of weights to the resultant set of edges that indicate their reliability Transformed PPI graph where Pi and Pj are connected if (Pi,Pj) is a hyperclique pattern Input PPI graph
Pair-wise H-Confidence • Measure of the affinity of two items in terms of the transactions in which they appear simultaneously [Xiong et al, 2006] • For an interaction network represented as an adjacency matrix: • Unweighted Networks: n1,n2=# neighbors of p1,p2 m=# shared neighbors of p1,p2 • Weighted Networks: n1,n2=sum(weights) of edges incident on p1,p2m = sum of min(weights) of edges to common neighbors of p1,p2
i j i j Related Approaches: Neighborhood-based Similarity • Motivation: Two proteins sharing several common neighbors are likely to have a valid interaction • Probability (p-value) of having m common neighbors given degrees of the two proteins n1and n2, and size of the network N [Samanta et al, 2003] • Handles the problem of high degree nodes • # common neighbors or Jacquard similarity (m/(n1+n2-m)) [Brun et al, 2003] • Min(fractions of common neighbors) = Min(m/n1,m/n2) • Identical to pairwise h-confidence
H-confidence Example Unweighted Network Weighted Network Hconf(p1,p2)= min(0.5,0.5) = 0.5 Hconf(p1,p2)= min(0.5/0.6,0.5/1.2) = 0.416
Sparsification to remove spurious edges Common neighbor- based transformation Pruning to remove spurious edges # edges = 6490 # edges = 95739 # edges = 6874
Validation of Final Network • Use FunctionalFlow algorithm [Nabieva et al, 2005] on the original and transformed graph(s) • One of the most accurate algorithms for predicting function from interaction networks • Produces likelihood scores for each protein being annotated with one of 75 MIPS functional labels • Likelihood matrix evaluated using two metrics • Multi-label versions of precision and recall: mi = # predictions made, ni = # known annotations, ki = # correct predictions • Precision/accuracy of top-k predictions • Useful for actual biological experimental scenarios
Test Protein Interaction Networks • Three yeast interaction networks with different types of weighting schemes used for experiments • Combined • Composed from Ito, Uetz and Gavin (2002)’s data sets • Individual reliabilities obtained from EPR index tool of DIP • Overall reliabilities obtained using a noisy-OR • [Krogan et al, 2006]’s data set • 6180 interactions between 2291 annotated proteins • Edge reliabilities derived using machine learning techniques • DIPCore [Deane et al, 2002] • ~5K highly reliable interactions in DIP • No weights assigned: assumed unweighted
Results on Combined data set Precision-Recall Accuracy of top-k predictions
Results on Krogan et al’s data set Precision-Recall Accuracy of top-k predictions
Results on DIPCore Precision-Recall Accuracy of top-k predictions
Noise removal capabilities of H-confidence • H-confidence and hypercliques have been shown to have noise removal capabilities [Xiong et al, 2006] • To test its effectiveness, we added 50% random edges to DIPCore, and re-ran the transformation process • Fall in performance of transformed network is significantly smaller than that in the original network
Summary of Results • H-confidence-based transformations generally produce more accurate and more reliably weighted interaction graphs: Validated function prediction • Generally, the less reliable the weights assigned to the edges in the raw network, the greater improvement in performance obtained by using an h-confidence-based graph transformation. • Better performance of the h-confidence-based graph transformation method is indeed due to the removal of spurious edges, and potentially the addition of biologically viable ones and effective weighting of the resultant set of edges.
References (I) [Pandey et al, 2006] Gaurav Pandey, Vipin Kumar and Michael Steinbach, Computational Approaches for Protein Function Prediction: A Survey, TR 06-028, Department of Computer Science and Engineering, University of Minnesota, Twin Cities [Pandey et al, 2007] G. Pandey, M. Steinbach, R. Gupta, T. Garg and V. Kumar, Association analysis-based transformations for protein interaction networks: a function prediction case study. KDD 2007: 540-549 [Xiong et al, 2005] XIONG, H., HE, X., DING, C., ZHANG, Y., KUMAR, V., AND HOLBROOK, S. R. 2005. Identification of functional modules in protein complexes via hyperclique pattern discovery. In Proc. Pacific Symposium on Biocomputing (PSB). 221–232. [Xiong et al, 2006a] XIONG, H., TAN, P.-N., AND KUMAR, V. 2003. Hyperclique Pattern Discovery, Data Mining and Knowledge Discovery, 13(2):219-242 [Xiong et al, 2006b] XIONG, H., PANDEY, G., STEINBACH, M., AND KUMAR, V. 2006, Enhancing Data Analysis with Noise Removal, IEEE TKDE, 18(3):304-319 [Xiong et al, 2006c] Hui Xiong, Michael Steinbach, and Vipin Kumar, Privacy Leakage in Multi-relational Databases: A Semi-supervised Learning Perspective, VLDB JournalSpecial Issue on Privacy Preserving Data Management , Vol. 15, No. 4, pp. 388-402, November, 2006 [Xiong et al, 2004] Hui Xiong, Michael Steinbach, Pang-Ning Tan and Vipin Kumar, HICAP: Hierarchical Clustering with Pattern Preservation, SIAM Data Mining 2004 [Tan et al, 2005] TAN, P.-N., STEINBACH, M., AND KUMAR, V. 2005. Introduction to Data Mining. Addison-Wesley. [Nabieva et al, 2005] NABIEVA, E., JIM, K., AGARWAL, A., CHAZELLE, B., AND SINGH, M. 2005. Whole-proteome prediction of protein function via graph-theoretic analysis of interaction maps. Bioinformatics 21, Suppl. 1, i1–i9. [Deng et al, 2003] DENG, M., SUN, F., AND CHEN, T. 2003. Assessment of the reliability of protein–protein interactions and protein function prediction. In Pac Symp Biocomputing. 140–151. [Gavin et al, 2002] A. Gavin et al.Functional organization of the yeast proteome by systematic analysis of protein complexes, Nature, 415:141-147, 2002 [Hart et al, 2006] G Traver Hart, Arun K Ramani and Edward M Marcotte, How complete are current yeast and human protein-interaction networks, Genome Biology, 7:120, 2006
References (II) [Brun et al, 2003] BRUN, C., CHEVENET, F.,MARTIN, D.,WOJCIK, J., GUENOCHE, A., AND JACQ, B. 2003. Functional classification of proteins for the prediction of cellular function from a protein-protein interaction network. Genome Biology 5, 1, R6 [Samanta et al, 2003] SAMANTA, M. P. AND LIANG, S. 2003. Predicting protein functions from redundancies in large-scale protein interaction networks. Proc Natl Acad Sci U.S.A. 100, 22, 12579–12583 [Salwinski et al, 2004] Salwinski L, Miller CS, Smith AJ, Pettit FK, Bowie JU, Eisenberg D (2004) The Database of Interacting Proteins: 2004 update. NAR 32 Database issue:D449-51, http://dip.doe-mbi.ucla.edu/ [Gavin et al, 2006] Gavin et al, 2006, Proteome survey reveals modularity of the yeast cell machinery, Nature 440, 631-636 [Deane et al, 2002] Deane CM, Salwinski L, Xenarios I, Eisenberg D (2002) Protein interactions: Two methods for assessment of the reliability of high-throughput observations. Mol Cell Prot 1:349-356