Download
1 / 16
160 likes | 294 Vues
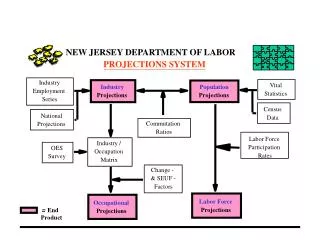
NEW JERSEY DEPARTMENT OF LABOR. PROJECTIONS SYSTEM. Industry. Vital. Industry. Population. Employment. Statistics. Projections. Projections. Series. Census. National. Data. Commutation. Projections. Ratios. Labor Force. Industry /. Participation. OES. Occupation. Rates.

E N D
NEW JERSEY DEPARTMENT OF LABOR PROJECTIONS SYSTEM Industry Vital Industry Population Employment Statistics Projections Projections Series Census National Data Commutation Projections Ratios Labor Force Industry / Participation OES Occupation Rates Survey Matrix Change - & SEUF - Factors Labor Force Occupational = Projections End Projections Product
Population and Labor Force Projections for New Jersey: 2006 to 2025
Population Projections Rate of Population Growth: 1990-2016 2006-2016 2000-2006 1990-2000 2006-2016 2000-2006 1990-2000 • New Jersey’s 2006-2016 population growth will continue to lag behind the nation as a whole.
Population Projections • New Jersey’s total population is projected to increase by 0.45% per annum, on average, from 2006 to 2016. • The state’s rate of population growth will be 0.58% per annum between 2016 and 2025.
Population Projections • Population aged 18-39 and 55+ will grow substantially.
Population Projections New Jersey Population by Age: 2006 and 2016 85+ 80-84 75-79 70-74 65-69 60-64 55-59 50-54 45-49 40-44 35-39 30-34 25-29 20-24 15-19 10-14 5-9 0-4 600 400 200 0 200 400 600 (Population in thousands) 2006 2016
Population Projections • Hispanics, Multiracial and Other Races are projected to grow fast.
Population Projections • Other Races and Hispanics will increase their shares of the state’s total resident population.
Population Projections • New Jersey’s sex ratio is projected to increase gradually as male population grow slightly faster than their female counterpart.
Labor Force Projections • New Jersey’s civilian labor force is projected to grow faster than its population from 2006 to 2016 but not after 2016. Growth of Population and Labor Force: New Jersey, 1980 - 2025
Labor Force Projections • The “older workers” (labor force aged 55 and older) will grow faster than their younger counterparts.
Labor Force Projections • Hispanics, Other Races and Multiracial labor forces are projected to grow fast.
Labor Force Projections • In fact, the “other races” will account for 40% and 70% of the state’s total labor force growth in 2006-2016 and 2016-2025 periods, respectively. • Hispanics will comprise the majority of the state’s labor force growth (70%) from 2006 to 2016. They will account for all the growth of New Jersey’s labor force between 2016 and 2025, as the no-Hispanic labor force is projected to decline somewhat.
Labor Force Projections • Consequently, Other Races and Hispanics will increase their shares of the state’s total civilian labor force.
Thank You Comments Welcomed Prepared by: New Jersey Department of Labor & Workforce Development Division of Labor Market and Demographic Research Contact: Sen-Yuan Wu (email:sywu@dol.state.nj.us tel. 609-292-0077)