Comparative Genomics II : Functional comparisons
Comparative Genomics II : Functional comparisons. Caterino and Hayes, 2007. Overview. I. Comparing genome sequences Concepts and terminology Methods Whole-genome alignments Quantifying evolutionary conservation ( PhastCons , PhyloP , GERP) Identifying conserved elements

Comparative Genomics II : Functional comparisons
E N D
Presentation Transcript
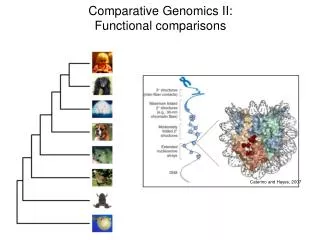
Comparative Genomics II: Functional comparisons Caterino and Hayes, 2007
Overview • I. Comparing genome sequences • Concepts and terminology • Methods • Whole-genome alignments • Quantifying evolutionary conservation (PhastCons, PhyloP, GERP) • Identifying conserved elements • Utility and limitations of conservation • Available datasets at UCSC • II. Comparative analyses of function • Evolutionary dynamics of gene regulation • Case studies • Insights into regulatory variation within and across species
Functional variation within and among species Human Chimp Rhesus Mouse
Regulatory variation contributes to human phenotypic variation Limb TFs Modularity of developmental gene expression overall limb Brain TFs gene A forebrain gene A Neural TFs neural tube gene A Regulatory changes introduce variance without disrupting protein function
Regulatory mutations affecting pleiotropic genes cause discrete developmental changes Letticeet al. Hum Mol Genet 12:1725 (2003) Sagaiet al. Development 132:797 (2005)
Patterns of selection on gene expression and regulation Neutral Constrained Directional Romero et al., Nat Rev Genet. 13:505 (2012)
Comparative approaches to identify conserved and variant regulatory functions Regulatory conservation Regulatory rewiring Visel and Pennacchio, Nat Genet 42:557 (2010)
Genetic drivers of gene regulatory variation Furey and Sethupathy, Science 2013
Comparative analysis of ChIP-seq datasets • H3K4me2 • H3K27ac • H3K4me2 • H3K27ac Compare TF binding, histone modifications, DNase hypersensitivity in equivalent tissues Human Requires a statistical framework to reliably quantify changes in ChIP-seq signals Mouse
Issues in comparative functional genomics • Input data are noisy: ChIP-seq, RNA-seq data are signal based, subject • to considerable experimental variation • Using comparable biological states within and across species • (e.g., human liver vs. mouse liver) = variation across tissues? • How do epigenetic states and gene expression diverge among • individuals and across species (Neutral? Constrained?) • Can we identify variants or substitutions that drive regulatory • changes?
Science 328: 232 (2010) • Targets: • RNA Polymerase II • NFkB • 10 human lymphoblastoid cell lines • 3 major population groups: European, East Asian, Nigerian • 9 females, 1 male • 9 analyzed by HapMap and 1000 Genomes
Variation in TF binding is common Pairwise difference in binding PolII NFkB Fraction of regions bound # individuals
Science 342: 747 (2013) • Targets: • RNA Polymerase II • H3K4me1, H3K4me3, H3K27ac, H3K27me3 • DNase hypersensitivity • 10 human lymphoblastoid cell lines • 1 population group (Nigerian) • All analyzed by HapMap and 1000 Genomes
Measuring allelic imbalance in histone modification profiles ChIP-seq reads G allele Allelic imbalance T allele Need to map reads reliably to individual alleles
Cis-quantitative trait loci ~1200 identified
Science 328:1036 (2010) • Targets: • CCAAT/enhancer binding protein a (CEBPA) • Hepatocyte nuclear factor 4a(HNF4A) • Essential for normal liver development and function • Tissue: • Adult liver from 4 mammal species plus chicken
Lineage-specific gain and loss of CEBPA binding in liver Lineage-specific: 0 bp overlap in multiple species alignment
Single TF binding events may not indicate regulatory function • Many TFs are present at high concentrations • in the nucleus • TF motifs are abundant in the genome • Single TF binding events may be incidental Enhancer-associated histone modification
Many TF binding changes do not have obvious genetic causes In mammalian liver:
Many TF binding changes do not have obvious genetic causes In mouse liver:
Cell 154:185 (2013) Human Rhesus Bud stage; digit specification Digit separation Mouse
Identifying human-lineage changes in promoter and enhancer function • Compare H3K27ac signal at orthologous sites • ‘Stable marking’: 1.5-fold or less change in • H3K27ac among human, rhesus and mouse • Human gain: require significant, reproducible • gain in human versus all 12 datasets in • rhesus and mouse
Mapping active promoters and enhancers in human limb ENCODE cell lines H3K27ac
Gains in promoter and enhancer activity • Bone morphogenesis • Chondrogenesis • Digit malformations in mouse
Human-specific H3K27ac marking correlates with changes in enhancer function
Epigenetic signatures reflect tissue identity and species relationships H3K27ac signal in human and mouse H3K27ac in human, rhesus, mouse Primate Mouse
Nature 478:343 (2011) • Human • Chimpanzee • Bonobo • Gorilla • Orangutan • Macaque • Mouse • Opossum • Platypus • Chicken • Custom gene models based on Ensembl + RNA-seq • 5,636 1:1 orthologs in amniotes • 13,277 1:1 orthologs in primates • Only constitutive exons
Gene expression divergence rates are tissue-specific testis liver brain
Gene expression divergence increases with evolutionary time Conservation of core organ functions restricts divergence
Summary • Comparative functional genomics identifies regulatory differences • within and among species • TF binding is variable within species and highly variable among • species • Epigenetic comparisons provide more insight into biologically • relevant regulatory diversity and divergence • Gene regulation and expression diverges with increasing • phylogenetic distance – they mirror neutral expectation