Identifying and estimating gene-gene and gene-environment interactions
830 likes | 1.11k Vues
Identifying and estimating gene-gene and gene-environment interactions. Christopher Amos 1,2 and Carol Etzel 1 Departments of Epidemiology and Bioinformatics and Computational Genetics U.T. M.D. Anderson Cancer Center, Houston, TX. Overview of talk. Description of terminology

Identifying and estimating gene-gene and gene-environment interactions
E N D
Presentation Transcript
Identifying and estimating gene-gene and gene-environment interactions Christopher Amos1,2 and Carol Etzel1 Departments of Epidemiology and Bioinformatics and Computational Genetics U.T. M.D. Anderson Cancer Center, Houston, TX
Overview of talk • Description of terminology • Epistasis modeling for quantitative traits • Epistasis modeling of linkage data in humans • Approaches to interaction modeling in human/ outbred populations • Modeling gene-environment interactions
What is an ‘interaction’ • Interaction is a kind of action that occurs as two or more objects have an effect upon one another. The idea of a two-way effect is essential in the concept of interaction, as opposed to a one-way causal effect. (Wikipedia)
Gene - Environmental Interaction Environment - + pure environment 2% spontaneous 15% - 17% Genetics gene- environmental interaction 78% pure genetic 5% + 83% 20% 80% 100% Schulte, 1994
Interactions • Biological interpretation • Two or more factors jointly modify a phenotype • e.g. risk from smoking is 14 fold increased by tobacco smoke, 3 fold in increased by asbestos exposure and 42 fold increased by both
Statistical Interpretation • Deviation from an additive model (on some scale). On a multiplicative scale, the above risks are additive, so there would not be evidence for interaction on a multiplicative scale
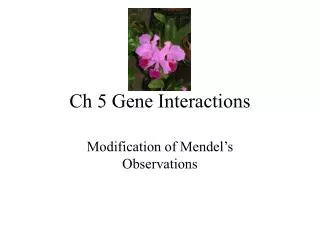
Definitions of Epistasis (Interaction among alleles at different loci) • Bateson: gene interaction, in a physical sense of the direct interaction between gene products. • First noticed when crossing chicken strains that only rarely was the single comb produced. Using a Punnett square this feature was shown to result as a doubly homozygous recessive trait • Another example is Bombay Phenotype
Batesonian Epistasis – Bombay Phenotype H allele is a precursor to ABO blood group, its absence (h) causes ABO phenotypes not to mature, hh genotype appears to express as O phenotype
Fisherian Epistasis • Joint effects of alleles at two loci do not influence a trait in an additive fashion • Deviation from a simple oligogenic or polygenic model – higher correlation among siblings than parent-offspring • Further Developed by Cockerham (Cockerham, C. C., 1954 An extension of the concept of partitioning ward to extend loci without further setting the orthogonal contrast when epistasis is present. Genetics 39: 859–882.)
2b Types of Epistatic Interactions AABB AAbb f Additive-Additive Epistasis b≠c d h Additive-Dominant Epistasis f≠g 2a Dominant-Dominant Epistasis h ≠ (d-e-(f-g))/2 aabb g aaBB 2c
Joint effects from multiple loci for quantitative traits • Let loci have alleles A, a and B, b • A typical approach (F∞) is to set design matrices - Then define interactions as additive x additive epistasis x1*x2, Additive x dominant interactions x1*z2 etc.
Characteristic of the (F∞) is confounding with epistatis (Kao and Zeng, Genetics 160:1243-1261, 2001)
Implications of using a model with confounding of effects • Inferences about effects can be biased depending upon the modeling procedure. • Additive main effect estimate includes a component due to dominance by additive epistasis • Dominance by additive epistasis estimate includes a component due to additive effects • If the Type I sums of squares procedure is used, then the main effect estimate is inflated and the epistasis estimate is reduced. If the Type III sums of squares procedure is used then both effects are reduced. • ML method could be used to estimate parameters if model is correctly specified.
Effects of Scale • For the quantitative trait just indicated, if additive by additive interaction is noted, it may be possible to change scale to remove this source of epistasis. However, if multiple genetic factors influence the trait, a change of scale may not be sufficient.
Heterogeneity versus Interaction • In Epidemiological studies, we usually treat all subjects as if they are exchangeable – i.e. they are all identically distributed • In genetics, we often assume that there our population reflects a mixture of features, may model with admixture or heterogeneity parameters • Admixture/heterogeneity ideas not well described in the interaction literature
Linkage analysis for multilocus models in humans • For ‘independence’ models in which the joint genotype-specific penetrances are products of each marginal genotype, modeling marginal penetrances yields sufficiently accurate models to permit linkage detection (whether using a parametric or nonparametric approach). • For ‘additive’ models in which penetrance is increased by presence of either factor, heterogeneity models are fitted.
Linkage Analysis of Lung cancer, with and without heterogeneity among families
Epistasis modeling • Linkage analysis is modeled according to generalization of Risch’s lambda (MLS) score method: • Weights depend upon the assumptions of the model (which can be fitted to multiplicative – independence – models) or to more general models (allowing for epistasis)
Joint effects of loci influencing risk for hypertension From Bell JT et al. Human Molecular Genetics 2006 15(8):1365-1374
Associating disease with mutations 1) usual approach for qualitative data logistic regression (unconditional) or Where y is the disease outcome y=1 if case, 0 if control x1 – design matrix with genotype AA =1, Aa=0, aa=-1 x2 - genotype AA=0, Aa =1, aa=0 Additive effect if b2= 0; dominance effects if b2 ≠ 0 If b2 ≠ 0, Can then fit x1 – design matrix with genotype AA =1, Aa=1, aa=0 (A dominant) x2 - genotype AA=1, Aa =0, aa=0 (A recessive)
Epistasis Modeling Humans • Where x1 and x2 are chosen to reflect best marginal models (dominant, recessive or additive) from consideration of univariable analyses
Changing scale may remove ‘interactions’ • Lung cancer risk and smoking and asbestos: interaction on an additive scale (risk from smoking is 14, asbestos is 3, sum is 17) • Lung cancer risk and smoking and asbestos shows no interaction on multiplicative scale (14 x 3 = 42) • What if you add in radon, which has an additive effect on risk? E.g. risk from radon is 2, risk from smoking is 14, risk from radon plus smoking is 16? If someone smokes, has radon exposure and asbestos exposure is there an additive scale?
SNP1 AA Aa aa BB SNP2 Bb bb Empty Cell “Curse of Dimensionality” • For 2 SNPs, there are 9 = 32 possible two locus genotype combinations. • If the alleles are rare (MAF10%), then some cells will be empty
SNP 3 CC SNP1 Cc SNP1 cc SNP1 SNP2 DD AA AA AA AA AA AA AA AA Aa Aa Aa Aa Aa Aa Aa Aa aa aa aa aa aa aa aa aa SNP 4 SNP2 BB BB BB BB BB BB BB BB Dd Empty Cell Bb Bb Bb Bb Bb Bb Bb Bb bb bb bb bb bb bb bb bb AA Aa aa SNP2 BB dd Bb bb “Curse of Dimensionality” 4 SNPs: 81 possible combinations with more possible empty cells
Tree Models • Response variable can be • Simple • disease indicator (categorical) • IBD sharing (continuous) • Number of chromosome breaks (counts) • Complex • Survival object • Regression object • Multivariate object • Predictor variables can be categorical, counts or continuous • Tree models provide some benefit over logistic regression with respect to identifying highest risk groups and not requiring assumptions, but tend to overfit data
Tree Models • First you “grow” the tree • Like forward regression • Only “important” predictors are put in the model • Control the growth of the tree • Setting limits on how many predictors to allow in the model • Then you “prune” the tree • Like backward regression • Only “significant” predictors are left in the model
Growing a Classification Tree U A U U U A U A A A A U A U U U A A U U A A U U U A U A A A Pr(A) = 0.50 Pr(U) = 0.50 15 Affected 15 Unaffected • Data are recursively partitioned into increasingly homogeneous subgroups • Partitions of the data are ‘branched out’ through binary splits
All Possible Binary Splits U A U U U A U A A A A U A U U A U A U U A A U U U A U A A A Male vs Female Genotypes BB vs Bb & bb BB & Bb vs bb BB & bb vs Bb DNA repair capacity (measure of risk of cancer) [6.26,8.96] 6.265 vs >6.265 6.275 vs >6.275
15 Affected 15 Unaffected Pr(A)=0.50 U A U Pr(U)=0.50 U U A U A A A A U A U U U A A Female U U A A U Male U U A U A A A U A U A U A A A U A U U A U A U A U U U A A U A A U A U U A Pr(A)=0.50 Pr(A)=0.50 Pr(U)=0.50 Pr(U)=0.50
15 Affected 15 Unaffected Pr(A)=0.50 U A U Pr(U)=0.50 U U A U A A A A U A U U U A A Family History Of Cancer U U No Family History Of Cancer A A U U U A U A A A U A A U A A A A U U A U U U A A U A U U U A U A A U A U U A Pr(A) = 10/15 = 0.667 Pr(A) = 5/15 = 0.333 Pr(U) = 5/15 = 0.333 Pr(U) = 10/15 = 0.667
Purity-Impurity of a Node U A U A U A U U A U A A U A A A A A U A U A A A U U A A A U A A A U U A A A A A A U A U U U A A U U A A A Pr(A) = 0.50 Pr(U) = 0.50 Pr(A) = 0.667 Pr(U) = 0.333 Pr(A) = 1.0 Pr(U) = 0.0 PURE IMPURE
Choosing splits • Different measures are used – • For ith group, Let Prob(Yi=1)=Ci, let wi be proportion of the sample in a given node • Entropy measure is • Σiwi{-(Ci)log2Ci—(1-Ci)log2(1-Ci)} • Gini Index is Σiwi(Ci)(1-Ci) • Bayesian (misclassification rate based on sample) – Σiwimin{Ci,(1-Ci)}
Goodness of a Split IS= p-Pr(AL)L - Pr(AR)R Entropy of Parent Node Proportion Affected in Left Daughter node Entropy of Left Daughter Node Proportion Affected in Left Daughter node Entropy of Left Daughter Node
U A U U U A U A A A A U A U U U A A U U A A U U U A U A A A U A U A U A A A U A A U U U A U A U A U U U A A U A U A U A P= 0.69 Female Male L= 0.69 R= 0.69 IS1 = 0.69-0.5*0.69 - 0.50*0.69 =0
U A U P = 0.69 U U A U A A A A U A U U U A A Family History Of Cancer U U No Family History Of Cancer A A U U U A U A A A L= 0.64 U R= 0.64 A A U A A A A U U A U U U A A U A U U U A U A A U A U U A IS 2= 0.69-0.667*0.64 - 0.333*0.64 =0.05
Choice of Best Split Variable Goodness of Split Sex 0.00 Family History 0.05
Stopping the Growth of a Tree • Minimum size of a node to split • Minimum size of a daughter node after a split • Misclassification cost: no more splits if no gain
Pruning a Tree • Minimum Error: Prune off branches such that subtree has minimum CV error • 1-SE Rule: Prune off branches such that subtree has CV error less than but not exceeding • Alternative Pruning Rules
Alternative Pruning Rule Vi k Vi > k Aff NA1 NA2 UnAff NU1 NU2 • Tree is allowed to overgrow • At each node, OR value is calculated from the test of Ho: OR=1.0 versus Ha: OR>1.0. Parent Node NA Affected NU Unaffected Daughter Node 1 NA1 Affected NU1 Unaffected Daughter Node 2 NA2 Affected NU2 Unaffected
Alternative Pruning Rule • The natural log of the odds ratio, ln(OR), follows a normal distribution with a mean of ln(1) = 0 • At each node, we can calculate a standard normal variate given by
Pruned branch Overgrown Tree Prune if max Z < Z.01=2.32 OR=1.85 Z=2.53 max Z=8.23 OR =1.90 Z=1.34 maxZ=2.00 OR =1.82 Z=2.93 max Z=8.23 OR =1.15 Z=2.00 max Z=2.00 OR =0.99 Z=0.10 max Z=0.10 OR =4.00 Z=6.00 max Z=8.23 OR =2.00 Z=1.58 max Z=1.58 OR =1.30 Z=1.96 max Z=2.00 OR=1.01 Z=0.80 max Z=0.80 OR =1.3 Z=1.16 max Z=1.20 OR =6.10 Z=8.23 max Z=8.23 OR =1.35 Z=2.00 max Z=2.00 OR =1.05 Z=1.00 max Z=1.00 OR =1.1 Z=0.20 max Z= 0.20 OR =1.5 Z=1.20 max Z=1.20