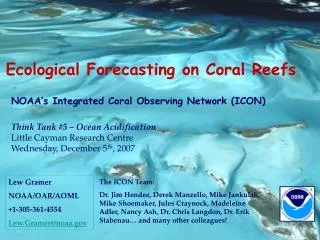
Ecological Forecasting on Coral Reefs
The ICON Think Tank focused on ecological forecasting and its application to coral reef ecosystems, specifically addressing the impacts of ocean acidification. By integrating satellite and in-situ data, NOAA’s Integrated Coral Observing Network enhances decision support for resource management, research, and public education. The ICON team employs real-time monitoring and predictive modeling to assess coral health, spawning events, and nutrient dynamics, ensuring proactive measures for coral conservation. This collaborative effort aims to mitigate the effects of environmental changes on coral reef ecosystems.

Ecological Forecasting on Coral Reefs
E N D
Presentation Transcript
Ecological Forecasting on Coral Reefs NOAA’s Integrated Coral Observing Network (ICON) Think Tank #5 – Ocean AcidificationLittle Cayman Research CentreWednesday, December 5th, 2007 Lew Gramer NOAA/OAR/AOML +1-305-361-4554 Lew.Gramer@noaa.gov The ICON Team: Dr. Jim Hendee, Derek Manzello, Mike Jankulak, Mike Shoemaker, Jules Craynock, Madeleine Adler, Nancy Ash, Dr. Chris Langdon, Dr. Erik Stabenau… and many other colleagues!
Data integration with our partners facilitates ecoforecasting for • Decision Support - Protected Area and resource management • Research – ecological model development and validation • Public information access, outreach and education
ICON and our partners have developed techniques to integrate satellite images and data with in situ data – in space and time Sea surface temperature Chlorophyll a Sea surface height Winds speeds and direction Also radar surface ocean currents, rainfall, circulation models , and in development – PAR, CDOM, other color-derived products!
The in situ data from the AOML ICON/CREWS and other stations is now being integrated with: • Satellite data courtesy of USF/IMaRS, Remote Sensing Systems Inc., NOAA NESDIS: • sea surface temperature (AVHRR, MODIS, AMSR-E, TMI) • chlorophyll a (MODIS) • winds (QSCAT) • precipitation (TRMM) • WERA ocean surface currents where available (UM/RSMAS) • In December: satellite PAR (light) from NASA and U. Central Michigan!
Ecological forecasts (ecoforecasts) – predict the impacts of physical, chemical, biological, and human-induced change on ecosystems and their components. But how are you going to do that? ICON’s approach is “now-casting”
ICON approach to ecoforecasting • Environmental sensors are monitored in near real-time • Hourly data or time-series evaluated for ecological significance • Subjective values assigned for each ecoforecast, each condition • “high”, “very high” or “drastic high” light for coral stress, • “conducive” sea temperature for coral spawning, etc. • Ecoforecast alerts can be triggered by individual conditions… • …or by multiple conditions that potentiate one another! • Alerts describe the severity and duration of each condition • - Stimulus/Response (or stress) index calculated • - Links provide graphs and maps for key conditions
NOAA ecoforecasts – ongoing • Coral bleaching (sea temperature + light + wind + circulation) • Spawning events (sea temperature + light + lunar phase) • – Of brooding corals such as P. astreoides • Nutrient delivery (chlorophyll + temperature anomaly + winds) • Doldrums and stratification (wind + attenuation + T + S)
NOAA ecoforecasts – future goals • Spawning events (fish, broadcast corals, other invertebrates) • Predicting larval transport, settlement, and survival • – integrating output from numerical models • Rainfall and run-off events ( => blooms, sedimentation) • Coral disease (high nutrients + high temperatures) • New research with partners drives our station and expert systems development
User Login: different access privileges for other menu choices. Station Home: Informational updates, links to maps, Landsat and other images. Sensors: Metadata, calibration info, configurations. Biology: Monitoring data, literature links. Data: All recent data + flexible data query. Graphs: Wealth of x/y, scatter and other plots, of all variables. Ecological Forecasts: Model descriptions, plus all bleaching, spawning, and other ecoforecast alerts.
Immediate access to station in situ data for today and for the past 72 hours • Daily - averaged or interpolated for each whole day • Hourly - interpolated if necessary to the start of each hour • Individual value - as of the reported time for that value(s) only
Ecological Forecasts daily via Web and email Detailed explanations of environmental triggers, as well as impact
Researchers can analyze data and develop forecasts using graphical tools User passwords to protect ecologically sensitive results Immediate feedback and forecasts are available via the Web
Approach for managing data complexity: Subjective grouping of values Subjective Data Ranges: ul unbelievably low av average dl drastically low sh somewhat high vl very low hi high lo low vh very high sl somewhat low dh drastically high uh unbelievably high Subjective Periods of the Day: Abbrev Period UTC Time Local (5 hours) Local (4 hours) --------------------------------------------------------------------------------------------------------- (Basic Periods) midn midnight 0300 - 0600 2200 - 0100 2300 - 0200 pdaw pre-dawn 0600 - 0900 0100 - 0400 0200 - 0500 dawn dawn 0900 - 1200 0400 - 0700 0500 - 0700 morn morning 1200 - 1500 0700 - 1000 0800 - 1100 midd mid-day 1500 - 1800 1000 - 1300 1100 - 1400 psun pre-sunset 1800 - 2100 1300 - 1600 1400 - 1700 suns sunset 2100 - 2400 1600 - 1900 1700 - 2000 even evening 0000 - 0300 1900 - 2200 2000 - 2300 (Large Groupings) all all-day 0300 - 0300 2200 - 2200 2300 - 2300 dayl daylight-hours 0900 - 2400 0400 - 1900 0500 - 2000 nite night-hours 0000 - 0900 1900 - 0400 2000 - 0500 dayb dawn-morning 0900 - 1500 0400 - 1000 0500 - 1100 aftn afternoon 1800 - 2400 1300 - 1900 1400 - 2000
Better understanding of the biological mechanisms, better predictability of coral bleaching and other ecological events, and better decision support for policy makers.
When conditions for this ecoforecast are met… • An S/RI is calculated in real time… • Email alerts are sent to all subscribers… • And full details of both the ecoforecast and relevant data are posted to ICON’s Website
A working example: coral stress • Research points to several factors besides temperature in thermal stress on corals: • Extended thermal exposure (e.g., monthly) • Incident light and water-column attenuation • Wind and wave action • Decreased local mixing, surface attenuation • But what role is played by each factor? • And are the combined effects predictable?
EFs often rely on accumulated stresses • intra-day, seasonal, and longer-term time series are easy to create and monitor within the ICON expert system
The biology of the response dictates the criterion to monitor – e.g., photo-accumulation mol quanta/m2s
ICON coral stress “back-casts” Sombrero Key, FKNMS, 1997-2007
Ecoforecast #2: onshore flux at Disco Bay • Cooler water to the reef • Sub-thermocline nutrients • Delivery of new recruits • Forcing may be local wind, or… • Surface wave action… • Internal tide breaking… • Eddy interactions may play a role… • And mixing offshore of the reef slope!
Sea temperature variability… At frequencies close to the dominant tidal signal
Example #3: Water column productivity changes • Among the criteria considered so far… • Light attenuation in the water column… • Dissolved CO2 relative to saturation… • Other indicators – satellite ocean color…
Example #3: Water column productivity changes • What are these events? • How can we characterize them in more detail • Are new data needed? A new view of existing data? • This ecoforecast is at a very early stage! Feedback from meetings like this one and collaboration with colleagues like you will help guide and refine our approach to this and similar ecoforecasts in the future…
~~ ICON Vision Statement ~~The ICON vision is to serve as a model for all of NOAA in establishing a high quality in situ coral reef monitoring network, and for the integration of near real-time in situ, satellite, radar and other data for ecological forecasting in coral reef ecosystems.
Goals • For the next few years, the ICON Program will be focusing upon: • Integrating data from diverse independent sources, especially for developing Ecological Forecasting models for use by MPA managers and researchers • Forging international partnerships • Facilitating development and transition to operations of promising relevant in situ instrumentation • Ensuring consistency with NOAA's Integrated Ocean Observing System (IOOS)
Oceanographic Sensors Standard Suite (both near-surface and near-bottom) • Sea Temperature • Salinity • Light (UV-A, UV-B, PAR) Additional Sensors • pCO2 , pH, TAlk (ocean acidification studies) • Pulse Amplitude Modulating (PAM) Fluorometry (real-time monitoring of stress response) • Moored ADCP (reef circulation, larval drift, sediment transport)
Integrating Coral Data for Research and Decision Support • Data integration is an important mandate for: • NOAA’s Coral Reef Conservation Program, and, • The Integrated Ocean Observing System, recommended by the U.S. Commission on Ocean Policy.
Integration, timeliness and information products are key concerns of the U.S. Commission on Ocean Policy: Recommendation 26–9. Congress should fund the Integrated Ocean Observing System (IOOS) as a line item in the National Oceanic and Atmospheric Administration (NOAA) budget, to be spent subject to National Ocean Council direction and approval. IOOS funds should be appropriated without fiscal year limitation. NOAA should develop a streamlined process for distributing IOOS funds to other federal and nonfederal partners. Recommendation 15-4. The National Oceanic and Atmospheric Administration, U.S. Geological Survey, and U.S. Environmental Protection Agency, working with other appropriate entities, should ensure that water quality monitoring data are translated into timely and useful information productsthat are easily accessible to the public and linked to output from the Integrated Ocean Observing System. Recommendation 21–4. The U.S. Coral Reef Task Force should identify critical research and data needs related to coral reef ecosystems. These needs should guide agency research funding and be incorporated into the design and implementation of the Integrated Ocean Observing System.
How ICON helps the IOOS efforts: • G2 (Gensym) Software (NOAA/HPCC funded application): • Powerful artificial intelligence and data integration platform (currently in use by FBI, CIA, NSA, DOD, Fortune 500, etc.). • Graphics and Web-oriented output • Provides off-the-shelf capabilities for near real-time data integration (“bridges”) • Integration of pylon/buoy, satellite, radar, biological, & other data sources • Applying integrated data streams to ecological forecasting…
Data Integration plus Expert Systems: a powerful ecological modeling tool…