Download

1 / 42
420 likes | 550 Vues
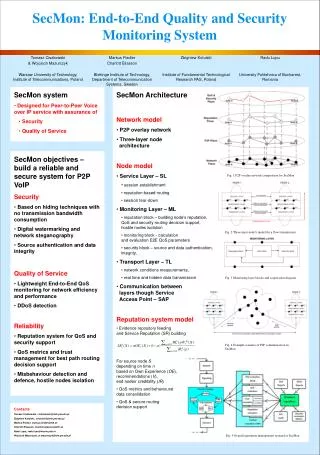
MAGGIE Monitoring and Analysis for the Global Grid and Internet End-to-end performance. Warren Matthews Stanford Linear Accelerator Center (SLAC). Abstract.

E N D
MAGGIEMonitoring and Analysis for the Global Grid and Internet End-to-end performance Warren Matthews Stanford Linear Accelerator Center (SLAC)
Abstract The ambitious distributed computing goals of data intensive science requires careful study of end-to-end performance across the networks involved. Since 1995, the Internet End-to-end Performance Monitoring (IEPM) group at the Stanford Linear Accelerator Center (SLAC) has been tracking connectivity between High Energy and Nuclear Physics (HENP) laboratories and their collaborating Universities and Institutes around the world. In this talk, results from measurements will be presented. Long term trends will be discussed. In particular, the development of a large end-to-end performance monitoring infrastructure involving automatic trouble-detection and notification will be featured.
Overview • Motivation for MAGGIE • High Performance Networks • Network Monitoring • Results • Publishing • Trouble-shooting and Fault Finding
Motivation • High Energy and Nuclear Physics • BaBar database contains ~1.5 billion particle physics event - over 750 TB • Increasing at 100 events per second – 8 MBps • 100s TB exported to BaBar centers and 100s TB Monte Carlo Simulations Imported • LHC will be an order of magnitude larger • Future of HENP is distributed data grid
More Motivation • Also other data intensive science • Astronomy, genetics • Other demanding applications • High-Res medical scans • Video-on-demand • Other fields • Digital Divide • Malaria Centers in Africa, SARS, AIDS.
High Performance Networks • SLAC has 2xOC12 (622Mbps) connections to Energy Sciences Network (ESnet) and California Research and Education Network (CALREN) • ESnet provides connectivity to labs, commercial and international • CALREN provides connectivity to UC sites and Abilene • High capacity well engineered networks • Bandwidth is required but not sufficient
Abilene Backbone • PDF Map on Internet2 WebSite This image taken from the Internet2 web site
Monitoring Projects (1/2) • Active (and over-active) • PingER/HEP (SLAC, FNAL) • PingER/eJDS (SLAC, ICTP) • AMP and AMP-IPV6 (NLANR) • RIPE-TT (RIPE) • Surveyor (Internet2, Wisconsin) • NASA • IEPM-BW (SLAC, FNAL) • NIMI (ICIR, PSC) • MAGGIE (ICIR, PSC, SLAC, LBL, ANL)
Monitoring Projects (2/2) • Passive • Netflow (Cisco, IETF) • SCNM (LBNL) • IPEX (XIWT, Telcordia) • NetPhysics • Also home-grown system.
End-to-end Monitoring • In reality most projects measure End-to-end performance • End-host effects are unavoidable • Internet2 End-to-end Performance Initiative • Most useful to users • Performance Evaluation System (PIPES) • MAGGIE
MAGGIE ICIR PSC IEPM-BW Measurement Engine SLAC FNAL NIMI Security and scheduling Other tools MAGGIE ANL SCIDAC Publishing AMP Fault Finding Analysis Engine NMWG LBNL UCL SLAC RIPE SLAC
IEPM-BW • SLAC package for monitoring and analysis • Currently 10 monitoring sites • SLAC, FNAL, GATech (SOX), INFN (Milan), NIKHEF, APAN (Japan) • UMich, Internet2 (Michigan), UManchester, UCL (Both UK) • 2-36 targets
KEK LANL EDG CERN NIKHEF TRIUMF FNAL IN2P3 NERSC ANL PPDG/GriPhyN CHI CERN ORNL RAL SNV ESnet JLAB NY UManc SLAC UCL SLAC JAnet DL NNW BNL APAN RIKEN Stanford INFN-Roma APAN Geant INFN-Milan CalREN Abilene SEA CESnet NY ATL SNV HSTN SOX CLV IPLS Monitoring Site CALTECH SDSC UTDallas I2 UFL UMich Rice NCSA
Measurement Engine • Ping, Traceroute • Iperf, Bbftp, Bbcp (mem and disk) • Abwe • Gridftp, UDPmon • Web100 • Passive (netflow)
PingER project has been tracking ping times to HEP collaborators since early 1995
Traffic Typically, Internet traffic is 70% http
Conclusions from IEPM-BW • Bbftp vs bbcp => Implementation • Iperf vs bbftp => Disk, CPU • Packet loss < 0.1% • TCP/IP parameters must be tuned • Web 100 • FAST, Tsunami • LSR
Publishing • Usual method is on the web • Too much to review frequently • Also time delay • Want to resolve problems before users complain • Alarm System based on Web Services • GGF NMWG/OGSA
Demo • Web service is fully described by WSDL • http://www-iepm.slac.stanford.edu/tools/soap/MAGGIE.html • Path.delay.oneWay (Demo)
Troubleshooting • RIPE-TT Testbox Alarm • AMP Automatic Event Detection • Our approach is diurnal changes
Diurnal Changes (1/2) • Parameterize performance in terms of hour and variability within that hourly bin • Median and standard deviation of measurements on Monday 7pm-8pm • AMP uses mean and variance • RIPE-TT uses rolling average and breaks day into 4
Diurnal Changes (2/2) • Measurements can be classified in terms of how they differ from historical value • “Concerned” if latest measurement is more than 1 s.d. from median • “Alarmed” if latest measurement is more than 2 s.d. from median • Recent problems are flagged due to difference from historical value • Compare to measurement in previous bin (e.g. Monday 6pm-7pm) to reduce false-positives
Limitations • Could be over an hour before alarm is generated • Need more frequent but sufficiently low impact measurements to allow finer grained troubleshooting • Migrating to ABWE
Trouble Detection $ tail maggie.log 04/28/2003 14:58:47 (1:14) gnt4 0.51 Alarm (AThresh=38.33) 04/28/2003 16:25:45 (1:16) gnt4 3.83 Concern (CThresh=87.08) 04/28/2003 17:55:21 (1:17) gnt4 169.57 Within boundaries Status Throughput (iperf) Date and Time Bin Node Only write to the log if an alarm is triggered Keep writing to the log until alarm is cleared
Trouble Status • Tempted to make color-coded web page • All the hard work still left to do • Use knowledge to see common point of failure • Production table would be very large • Instead figure out where to flag
Net Rat • Inform on possible problem locations • Starting point for human intervention • No measurement is ‘authoritative’ • Cannot even believe a measurement • Multiple tools and Multiple measurement point - Cross reference • Trigger further measurements (NIMI)
Net Rat Methodology (1/4) • If last measurement was Within 1sd • Mark each hop as Good • Hop.performance = good • If last measurement was “Concern” • Mark each hop as acceptable • If last measurement was an “Alarm” • Mark Each hop as poor
Net Rat Methodology (2/4) • Measurement generates an alarm • Set each hop.performance = poor
Net Rat Methodology (3/4) • Other measurements from same site do not generate alarms. • Set each hop.performance = good • Immediately ruled out problem in local LAN or host machine
Net Rat Methodology (4/4) • Different site monitors same target • No alarm is generated • Set each hop.performance = good • Pinpointed possible problem in intermediate network. • Of course it couldn’t be that simple
Arena • Report findings to informant database • Internet2 Arena database • PingER Nodes database • PIPES Culprit/Contact Database
Toward a Monitoring Infrastructure • Certainly the need • DOE Science Community • Grid • Troubleshooting / E2Epi • Many of the ingredients • Many monitoring projects • Many tools • PIPES • MAGGIE
Summary “It is widely believed that a ubiquitous monitoring infrastructure is required”.
IEPM-BW ESnet ABwE AMP NIMI RIPE-TT E2E PI SLAC Web Services GGF NMWG Arena AMP TroubleShooting Links
Credits • Les Cottrell • Connie Logg, Jerrod Williams • Jiri Navratil • Fabrizio Coccetti • Brian Tierney • Frank Nagy, Maxim Grigoriev • Eric Boyd, Jeff Boote • Vern Paxson, Andy Adams • Iosif Legrand • Jim Ferguson, Steve Englehart • Local admins and other volunteers • DoE/MICS
Output from the demo on slide 25 #!/usr/bin/perl use SOAP::Lite; my $answer = SOAP::Lite -> service('http://www-iepm.slac.stanford.edu/tools/soap/wsdl/profile_07.wsdl' ) -> pathDelayOneWay("tt81.ripe.net:tt28.ripe.net",""); print $answer->{NetworkTestTool}->{toolName},"\n"; print $answer->{NetworkTestInfo}->{time},"\n"; print $answer->{NetworkPathDelayStatistics}->{value},"\n"; % ./soap_client.pl ripe-tt 20030628215739.91155397892 0.075347