Download
1 / 9
90 likes | 105 Vues
In this universe 90% of the matter is dark matter which is not visible and 10% of the matter is baryonic matter which is visible. Baryonic matter includes all the galaxies that we see today. But the evolution of large scale structure includes the underlying dark matter. Dark matter is only affected by gravitational field whereas the baryonic matter is affected by gravitational field as well as radiation pressure, magnetic field etc. This difference leads to the study of bias factor called as cosmological bias. The field of research is open for the study of cosmological properties which is possible by the study of cosmological bias. It is the ratio of baryonic matter density to the dark matter density.

E N D
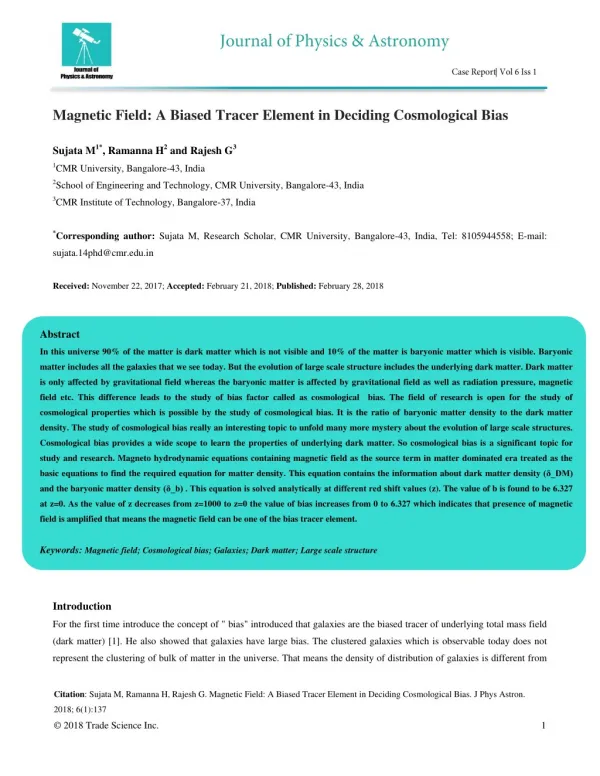
Magnetic Field: A Biased Tracer Element in Deciding Cosmological Bias Sujata M1*, Ramanna H2 and Rajesh G3 1CMR University, Bangalore-43, India 2School of Engineering and Technology, CMR University, Bangalore-43, India 3CMR Institute of Technology, Bangalore-37, India *Corresponding author:Sujata M, Research Scholar, CMR University, Bangalore-43, India, Tel: 8105944558; E-mail: sujata.14phd@cmr.edu.in Received: November 22, 2017; Accepted: February 21, 2018; Published: February 28, 2018 Abstract In this universe 90% of the matter is dark matter which is not visible and 10% of the matter is baryonic matter which is visible. Baryonic matter includes all the galaxies that we see today. But the evolution of large scale structure includes the underlying dark matter. Dark matter is only affected by gravitational field whereas the baryonic matter is affected by gravitational field as well as radiation pressure, magnetic field etc. This difference leads to the study of bias factor called as cosmological bias. The field of research is open for the study of cosmological properties which is possible by the study of cosmological bias. It is the ratio of baryonic matter density to the dark matter density. The study of cosmological bias really an interesting topic to unfold many more mystery about the evolution of large scale structures. Cosmological bias provides a wide scope to learn the properties of underlying dark matter. So cosmological bias is a significant topic for study and research. Magneto hydrodynamic equations containing magnetic field as the source term in matter dominated era treated as the basic equations to find the required equation for matter density. This equation contains the information about dark matter density (δ_DM) and the baryonic matter density (δ_b) . This equation is solved analytically at different red shift values (z). The value of b is found to be 6.327 at z=0. As the value of z decreases from z=1000 to z=0 the value of bias increases from 0 to 6.327 which indicates that presence of magnetic field is amplified that means the magnetic field can be one of the bias tracer element. Keywords:Magnetic field; Cosmological bias; Galaxies; Dark matter; Large scale structure Introduction For the first time introduce the concept of " bias" introduced that galaxies are the biased tracer of underlying total mass field (dark matter) [1]. He also showed that galaxies have large bias. The clustered galaxies which is observable today does not represent the clustering of bulk of matter in the universe. That means the density of distribution of galaxies is different from Citation: Sujata M,Ramanna H, Rajesh G. Magnetic Field: A Biased Tracer Element in Deciding Cosmological Bias. J Phys Astron. 2018; 6(1):137 © 2018 Trade Science Inc. 1
www.tsijournals.com | February-2018 the density of underlying dark matter. So the galaxy density is a function of dark matter density [2]. In large scale the galaxy density smoothed one and can be written as δg=f (δ) where f(δ) – linear function of density contrast of dark matter in same scale. Bias can be written as b=δg/δ analytically showed that the initial mass density fluctuations which collapse first to form galaxy are more clustered than the underlying dark matter. Bias depends on mass of dark matter halo as well as epoch of galaxy formation was determined by Mo and White (1996) using extended press-Schechter theory [3-5] and developed the evolution of bias with red shift found bias is scale dependent and on large scale bias tends towards a constant value. Origin and evolution of magnetic field is still an unsolved problem today. So lots of works are going on to solve this problem. Observations of the cosmic microwave background provides a base to know about whether the magnetic field is of primordial cosmological origin. A magnetic dynamo amplifying the initial seed of magnetic field could describe the strength of the magnetic field existing in galaxy today. Cosmic magnetic field plays a significant role in formation of large scale structures like galaxy, clustered galaxy etc. The seed of magnetic field may arise from the turbulent flow of ionised materials and further extended by the supernova explosion. It may be explained by the future generation by radio telescopes. In large scale in galaxy the plane polarised light is rotated in presence of magnetic field which implied the presence of magnetic field. Scientists like Alfven, Biermann, Chandrasekhar and Parker realized that the evolution of the magnetic field played a crucial role in formation of stars, stellar activity, pulsars, accretion disks etc. Because the universe is in a plasma/ionised state permeated by magnetic field. The universe is filled with 90% of the dark matter and 10% of the baryonic matter. The dark matter is invisible and only affected by gravity. But baryonic matter is affected by both gravity and magnetic field. So magnetic field works as one of the bias tracer element to explain the evolution of large scale structures like galaxies and clustered galaxies etc. Working on magnetic field and finding its significant role solves many cosmological puzzles. It helps to describe many cosmological parameters. Different cosmological models are used to study the evolution of small scale bias (0.2-7 h-1MPC) like ΛCDM, OCDM, SCDM, τCDM etc. using simulations. Another model called quintessence cosmological model was studied by S. Basilakos, M. Plionis in which biasing was weak. But in large scale the bias value approaches unity. Case Presentation Magnetohydrodynamic equations The magneto-hydrodynamics equations in commoving coordinates after recombination in linearized Newtonian theory are [6]: b d av dt B B b (1) 4 a .b v (2) b a B t . B 2 2 4 Ga (3) DM DM b b 2 2 a B b a (4) 0 (5) 2
www.tsijournals.com | February-2018 In equation (1) the pressure gradient from the matter is neglected as it is the matter dominated era. Here v_b=peculiar velocity, B=magnetic field at recombination. Equation (1) and (2) can be combined to give: 2 a a 2 4 ( , ) S t x b b G (6) m m 2 t t 2 a a 2 4 ( ) 0 G DM DM t DM DM b b 2 t 2 a a 2 4 ( ) 0 G DM DM t (7) DM DM 2 t 2 .(( B) B) a a 2 4 m m b G m m 2 2 2 4 t t a m b 2 a a 2 4 ( , ) S t x m m b G (8) m m 2 2 t t m Here the subscript ‘b’ refers to baryonic component and the subscript ‘DM’ refers to the dark matter component. Fluid equation for the dark matter component equation (7) has been derived by dropping the magnetic field term (Peebles 1980). The equations (6), (7), (8) are considered to know the evolution of density perturbation of baryonic matter, dark matter and magnetic field. Here S (t, x) is the source term containing the magnetic field. The dark matter is not directly affected by the magnetic field. To solve these equations, we define and . The solutions to m m DM DM b b m DM b equation (6) and (8) by the usual Green’s function method (Peebles 1980). ( , ) S t x D t W t ( ) ( , ) S t x D t W t ( ) t t ( ) ( ) 2 1 D t dt D t dt (9) 1 2 b ( ) ( ) t t i i ( )D (t) B(x)D (t) A x 1 2 m ( , ) S t x D t W t ( ) ( , ) S t x D t W t ( ) t t ( ) ( ) 2 1 D t dt D t dt (10) 1 2 ( ) ( ) t t i i ( ) ( ) ( ) ( ) ( ) W t D t D t D t D t 2( ) D t are the solutions of homogeneous part 1( ) D t and Here W (t)= is the Wronskian. 1 2 2 1 evolution (Peebles 1980). of m 3
www.tsijournals.com | February-2018 2 3 t t 1( ) D t The solution to above equation can be found by considering the growth factor and the decay factor i 1 3 2 ( ) it t it 1 5 3( ) B ( , ) S t x D t D t D t D t 2( ) D t ( ) . ( ) W t ( ) ( ) ( ) ( ) W t . Here . Solving further . 1 2 2 1 4 3 2 2 4 a X G t The second term [B (x) D2(t)] can be ignored as it is decaying with increase epoch. ( , ) (x)D ( ) ( ) W t dt S t x D t dt S t x D t ( ) ( , ) W t ( ) t t ( ) 2 1 A D t D t (11) 1 1 2 m ( ) t t i i In equation (11) the 1st term represents the information about dark matter density and the 2nd, 3rd terms together represents the baryonic matter density. To find 1st term 1 2 2 2 ( , ) x t | ( )| K dK K 0 2 2 1 2 n dK K AK 2 2 4 2( K 1 A n forsmoothscale 8 3 dK K K 2 8 2 ( ) P K W ( ) KR The value of the constant 'A' is calculated using the equation where powerspectrum 2 2 2 2 e 2 2 4 2 /2 n K R ( ) P K (0.5) ( ) AK A R 2 8 W KR 0.5 and and window function The value of 4 K 2 2 4 (X, ) (0.5) t R 0 2 8 2 1 4 1 4 ) (0.5) (8 ) (1 h MPC hMPC (X, ) 11.313 t ( ) A X D t ( ) 1 0 0 ( ) ( ) D t D t ( ) A X D t ( ) (X)D ( ) A 1 t 1 1 0 1 0 1 11.313 (12) 1 Z Where, t0=current epoch, t=time at any epoch Where, z=red shift. =11.313 for z=0 4
www.tsijournals.com | February-2018 =1.131 for z=10 =0.113 for z=100 To find 2nd term , dt S t x D t W t t 2 D t 1 t i 2 1 t t B dt i 2 3 2 2 4 a X t t t G t 1 3 t t 5 3 i i i 43 2 3 B a t density at any epoch , t B a Using scale factor 3 2 a t 2 0 1 B tdt t i 4 2 G a 2 3 2 4 a t t 3 a t 13 t t t 5 3 i i i 43 2 3 2 3 5 4 1 1 a B X t t t 2 1 i t t 0 dt 3 3 2 3 t i G i 2 3 5 4 1 B X t t t 2 1 t t 0 dt 3 3 2 t i G 5 2 3 B t 2 t t 3 2 0 0 t dt 3 2 20 X t i G it t 12 18 10 sec 10 sec Where, initial epoch [5]. To convert time scale to red shift (z) scale, the relation and 0 ot 3 21 t z it t 0 t dt 12 18 10 sec 10 sec is used. So, dz. For 32 52 1 z z 5 23 3 3 2 B X t t t 3 z 2 0 o t dz 5 5 2 20 1 z z 1 1 z z 2 2 i G 2 2 0 B t 9 z 0 dz 2 40 1 x z z i G 5
www.tsijournals.com | February-2018 g 30 9 10 XG=1 MPC=1024 cm 10 B Where, gauss, 3 0 cm 0 9 1 0 z z 0 i 3 40 1 10 z 9 1 0 iz z (13) 010 3 40 1 z Keeping the lower limit fixed and changing the upper limit different values will be obtained. =71.619 for z_0=0 =6.445 for z_0=10 =0.638 for z_0=100 To find 3rd term 2 t , dt S t K D t W t t 1 D t i 23 2 1 B t t dt 2 2 4 a X t t t G i i 13 t t t 5 3 i i 43 2 3 B a t t , , 0 2 o a B Using 3 t a 0 2 2 0 3 1 B t t dt 4 2 G a X 2 4 a 0 3 i t t a t i 13 i t t t 5 3 i i 43 2 0 X 3 1 1 a B t t t t t 2 i dt 2 G 3 20 t i 0 i 2 0 X t 3 1 B t t t t 2 0 dt 2 G 20 t i 0 i 3 1 z 2 0 X 2 3 B t 2 0 t dt 2 G 20 t t i 0 0 6
www.tsijournals.com | February-2018 2 0 X 3 3 2 B t z 3 0 1 0 z z t dz 2 0 5 2 2 G 20 1 z i 0 2 0 9 1 3 2 B X 0 3 3 2 3 2 2 0 1 1 1 t z z z 2 0 i 2 40 3 10 0 G 3 0 3 2 3 2 3 2 1 1 1 z z z (14) 0 i 20 3 10 Keeping the lower limit fixed and changing the upper limit different values will be obtained (TABLE 1). =-0.0477 for z=0 =-0.0476 for z=10 =-0.046 for z=100 Using the values of three equations (12), (13), (14) at different red shift values in equation (11) density of total matter density can be obtained. The first term represents dark matter density δ_DM. Sum of second and third term represents baryonic matter density δ_b. The cosmological bias (b) can be found by taking the ratio of δ_b⁄δ_DM (FIG. 1, 2 and 3). TABLE 1. z represents red shift, δbrepresents baryonic matter density, δDMrepresents dark matter density, δm represents total matter density, b represents cosmological bias. ⁄ z δb 71.572 6.398 0.592 0.041 0.001 0 δDM 11.313 1.02 0.112 0.022 0.012 0.011 b 6.327 6.27 5.285 1.8 0.083 0 82.892 7.418 0.704 0.063 0.013 0.011 FIG. 1. It shows that the bias (b) increases slowly with change of red shift (z) from high to low value. 7
www.tsijournals.com | February-2018 FIG. 2. This figure clearly indicates that clustering of baryonic matter and total matter are faster than clustering of dark matter at z<500, which give rise to bias. At z>500 perturbations for baryonic as well as dark matter are almost equal. FIG. 3. It shows that bias (b) remains very low at high value of z indicating that perturbations are less for all kinds of matter but at z=100 ' b' starts increasing sharply approaching towards current epoch indicating that perturbations are very high at current epoch. Discussion The time scale is converted into red shift scale (z) to see the variation of bias with scale in different red shift values. The complete result is represented in the TABLE 1. At current epoch (z=0) cosmological bias has the highest value 6.327. This value gradually decreases with the increase of red shift (z) value and b=0 at z=1000. A graph (b~z) has been plotted which is represented in FIG. 1. This figure represents that the rate of clustering formation of large scale structures like galaxies is 8
www.tsijournals.com | February-2018 more than the rate at which the dark matter have been clustered. which leads to the bias effect. Baryonic matter density is affected by various forces like gravity, magnetic field etc. while dark matter density is only affected by gravity. So bias value increases with decrease of z-values means that the magnetic field value has been amplified gradually with decrease of red shift z. FIG. 2 represents that for 100<z<500 the perturbations for baryonic matter and hence total matter are high and goes on increasing along y-axis approaching towards current epoch. So bias increases. But perturbations for dark matter has deviated a little along y-axis for z<10. And its value is 11.313 at z=0. So the baryonic matter is being biased by dark matter leading to high value of bias. Brand Kate, et al. (APJ 2003) found value of galaxy bias as 4 at z=0.35. The authors Loveday J. et al. (APJ 1996) through Red Shift survey found the galaxy bias value as 3 for L* galaxies. The values of bias found in simulations by Petro Colin et al. 1999 agrees well with LBGS (Lyman-break galaxies) clustered at z=3 at scales 5-10 h-1 MPC having bias values b=4.5 (flat model). Values of cosmological bias studied here is 6.327 at z=0. Whereas b=4.5 at z=3 studied by Petro Colin et al. which are close by results. Conclusion From TABLE 1 it is concluded that the galaxy bias and the magnetic field are directly proportional to each other. If bias value is more that indicates the clustering of baryonic matter density is greater than the clustering of dark matter density. In other sense it leads to formation of galaxy, galaxy clusters etc. If value of magnetic field goes on increasing then bias factor also increases. Which indicates that magnetic field plays an important role in formation of large scale structures in universe as dark matter is only affected by gravity but not by magnetic field. So study of the link between magnetic field and galaxy bias is of great significance in this universe. By studying cosmological bias many unsolved puzzles about dark matter, formation of large scale structures like galaxies can be solved. REFERENCES 1.Kaiser nick. On the spatial correlations of Abell clusters. Astrophysics.1984;284:12. 2.Scoccimaro R, Sheth RK, Hui L, et al. The clustering of galaxies in the SDSS-III baryon oscillation. Astrophysics. 2001;546:20-34. 3.Fry JN. Biasing and hierarchical statistics in large-scale structure. Gaztanaga Enrique.1993;24. 4.Tegmark M, Peebles PJE. The time evolution of bias. The Astrophysical Journal. 1998;500:2. 5.Colin P, Klypin AA, Kravtsov AV, et al. Evolution of bias in different cosmological models. APJ. 1999;523. 6.Wasserman I. Cosmological magnetic field limits in an inhomogeneous Universe. APJ. 1978;224:337. 9