Interpreting NMR Spectra
470 likes | 1.08k Vues
Interpreting NMR Spectra. Chemistry 318 Week 2 Fall 2018. Today. You will meet in a recitation room for the NMR Spectroscopy lecture. Tuesday (9/4/18): Merten Hall 3300 Wednesday (9/5/18): Planetary Hall 312 Thursday (9/6/18): Research Hall 301 Friday (9/7/18): Planetary Hall 312.

Interpreting NMR Spectra
E N D
Presentation Transcript
Interpreting NMR Spectra Chemistry 318 Week 2 Fall 2018
Today You will meet in a recitation room for the NMR Spectroscopy lecture. • Tuesday (9/4/18): Merten Hall 3300 • Wednesday (9/5/18): Planetary Hall 312 • Thursday (9/6/18): Research Hall 301 • Friday (9/7/18): Planetary Hall 312
Today • This presentation will focus on interpreting 1H- and 13C-NMR spectra to deduce the structure of organic compounds. • You can either print the spectra slides (4-6/page) or bring a device to view this PPT file. • There will be a quiz that covers concepts and terminology on NMR from the reading assignment. • There will not be interpretation of NMR spectra this week.
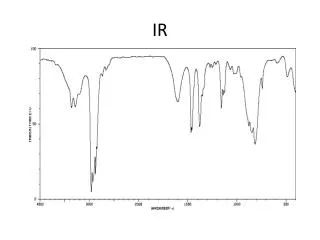
Next Week… • Lecture on Mass Spec and IR Spectroscopy (see the IR PowerPoint). • Brominationof Toluene experiment. • Be sure to prepare for the experiment in your notebook as explained in the Lab Manual pp. 4-8. • Pay particular attention to the Safety Information you present in the Chemical Property Table. • The quiz will include questions about the experiment and simple interpretation of NMR spectra.
Introduction – Atomic Spin • Just as electrons have a spin quantum number of ½, protons and neutrons (nucleons) also have a spin of ½. • The nucleus has a spin (I) that is the resultant of the spins of the nucleons. • Atomic nuclei with either an odd number of protons or neutrons in their nucleus have a half-integral nuclearspin. 1H, 13C, and 15N but not 12Cor 16O
Introduction – Atomic Spin • The positively charged spinning nucleus generates a small electric current and thus also generates an associated magnetic field. • When the nuclei are placed in an external magnetic field, their magnetic spins align either with the external magnetic field (lower energy) or against it (higher energy). • The energy difference between the two spin states is directly proportional to the strength of the applied magnetic field. • A very strong magnetic field is required for an energy separation that will be ultimately detected.
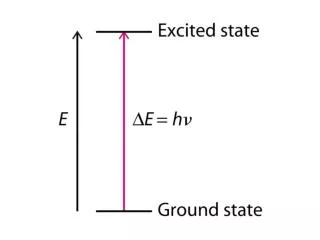
Introduction – Change in Nuclear Magnetic Moment • The energy difference between the two spin states is in the radiofrequency range of the electromagnetic spectrum. When the irradiation energy equals the spin energy difference, the nucleus in the lower energy spin state absorbs the energy and is excited to the higher spin energy state (against the external field).
Introduction • The magnetic “spin-flip” transition is in "resonance" with the applied radiation. • The energy absorption is detected in the NMR spectrometer and the output is the NMR spectrum. • The horizontal scale is measured in ppm, parts per million (see Note).
Introduction • Nuclear magnetic resonance is useful for determining the structure of organic compounds because both the 13C-isotope of carbon and the 1H-isotope of hydrogen produce NMR signals. • Although most carbons are the 12C isotope ,~ 1.1% of carbons are the 13C isotope with an extra neutron. Modern instrumentation is sensitive enough to detect signals from these isotopes. • Most hydrogens are the 1H-isotope – 1 proton in the nucleus and no neutrons. • For nuclei in different bonding environments, the resonance energy is different and appears at different ppm in the spectrum. Most carbons and hydrogens in organic compounds are in different bonding environments.
13C-NMR Spectroscopy Information obtained from a 13C NMR spectrum: • the number of resonance signals denotes the number of different (non-equivalent) carbon atoms present • the chemical shift reveals the electronic bonding environment of the carbons • signal splitting (singlet, doublet, triplet, etc.) gives the number of hydrogens bonded to each carbon
13C-NMR Spectroscopy • The range of chemical shifts is about 0-220 ppm. • Saturated carbon atoms absorb upfield (smaller ppm) relative to unsaturated carbons (downfield). • Electron-withdrawing atoms cause a downfield shift. • Compare –CH2– with –CH-O– and compare C=C with C=O
Hexane ppm 14.16 q 22.89 t 31.87 t Please view the slide with Notes underneath.
Carbon-Hydrogen Spin Splitting • A spectrum can be obtained that “couples” the spin of a carbon and the hydrogens that are bonded to it. • The resulting “splitting” pattern shows the number of hydrogens bonded to the carbon. • Number of H’s attached to C = n-1 where n is the number of split peaks. n n-1 Quartet(q) 3 H’s -CH3 methyl Triplet(t) 2 H’s -CH2- methylene Doublet(d) 1 H >CH- methine Singlet(s) 0 H
Hexane ppm 14.16 q 22.89 t 31.87 t q = quartet n=4 n-1=3 CH3 t = triplet n=3 n-1=2 CH2
2,2-Dimethylbutane 8.88 q 28.96 q 30.42 s 36.49 t
Ethyl propionate ppm 171.40 s 60.26 t 27.71 t14.32 q9.19 q
ortho-Xylene(1,2-dimethylbenzene) ppm 134.66 s 129.21 d 128.97 d20.90 q
1H-NMR Spectroscopy Information obtained from a 1H NMR spectrum: • the number of resonance signals denotes the number of different (non-equivalent) hydrogen atoms present • Integration of the peak areas gives the relative number of hydrogens causing the resonance • the chemical shift reveals the electronic bonding environment of the hydrogens • signal splitting (singlet, doublet, triplet, etc.) gives the number of hydrogens bonded to the adjacent atom(s)
1H-NMR Spectroscopy • Chemical shift range is about 0-12 ppm. • Hydrogens bonded to saturated carbons absorb up-field relative to hydrogens on unsaturated carbons (downfield). • Electron-withdrawing atoms cause a downfield shift. • compare >CH– with >CH-O–and compare C=CHwithHC=O
1H-NMR Spectroscopy Chemical shift: There are two resonance peaks, indicating two different kinds of H’s. The upfield signal is in the saturated C region; the downfield signal is in the unsaturated C region.
1H-NMR Spectroscopy Integration: The area under the peak is proportional to the number of hydrogens causing the absorbance. After integration and rounding to small whole numbers, the peak area ratio is 5:3.
1H-NMR Spectroscopy Spin-spin splitting: A resonance peak is split into n+1 peaks by n H atoms on adjacent atoms. The CH3 resonance is split by the neighboring CH2. There are n=2 neighboring H’s and so the resonance is split into n+1=3 peaks – a triplet. Integration: 2:3
1H-NMR Spectroscopy Spin-spin splitting: A resonance peak is split into n+1 peaks by n adjacent H atoms. The CH2 resonance is split by the neighboring CH3. There are n=3 neighboring H’s and so the resonance is split into n+1=4 peaks – a quartet. Integration: 2:3
1H-NMR Spectroscopy Spin-spin splitting: A resonance peak is split into n+1 peaks by n adjacent H atoms. These are some simple, common splitting patterns: Ethyl group is a quartet-triplet, integration 2:3 Isopropyl group is a septet (hard to see) and a doublet, integration 6:1 Para-disubstituted benzenes give this symmetrical splitting; other substituted benzenes are not well-resolved. Relative integrations are shown.
Pivaldehyde (dimethylpropanal) A: I = 1, sB: I = 9, s
Practice #1 %C = 73.75% %H = 12.40%
Internal Standards & Solvents • An internal standard, which is calibrated to appear at the highest up-field position (0 ppm) is used for all NMR spectroscopy • TMS = tetramethylsilane • Why use TMS? • DMSO – d6 (DMSO – d5) and CDCl3 are common solvents used in NMR sample preparations • DMSO = dimethylsulfoxide • CDCl3 = deuterated chloroform • Why use deuterium?
13C NMR Terminology • Signal peak intensity • How high/intense the peaks are • Resonance peak/signal • peaks/signals that appear in a spectra • Up-field • Towards 0 ppm – resonance peaks up-field tend to be saturated • Down-field • Towards 220 ppm – resonance peaks shifted this direction tend to be unsaturated • Spin splitting • Pattern of peaks that shows the number of hydrogens bonded to a carbon
1H-NMR Terminology • Signal peak intensity/relative area/intensity • How high/intense the peaks are • Tells us relative number of hydrogens causing resonance • Resonance peak • Peaks that appear in a spectra • Up-field • Towards 0 ppm – resonance peaks up-field tend to be saturated • Down-field • Towards 12 ppm – resonance peaks dn-field tend to be unsaturated • Signal splitting • Pattern of peaks that shows the number of hydrogens bonded to an adjacent atom(s)
Systematic 13C-NMR Interpretation Look at the spectrum! Don’t let the information overwhelm you, but put it together like a puzzle. • How many resonance peaks appear? • What does this tell you? • Label TMS and DMSO (if present) • Look at the chemical shift – use correlation chart! • Upfield or downfield? • What does this tell you? • Are there electronegative atoms present? • What does the carbon-hydrogen splitting tell you about the # of hydrogens attached to a given carbon?
Systematic 1H-NMR Interpretation Look at the spectrum! Don’t let the information overwhelm you… Put it together like a puzzle. • How many resonance peaks appear? • What does this information tell you? • Label TMS and DMSO or CDCl3 (if present) • Look at the chemical shift – use your correlation chart! • Are peaks up-field or down-field? • What does that tell you? • Are there electronegative atoms present? • What does the peak intensity/relative area/integration tell you? • What does the splitting tell you?