ARM Debug Architecture with JTAG and Multi-ICE Speaker
210 likes | 281 Vues
Understand the content and architecture of ARM debug with JTAG and Multi-ICE. Learn how to utilize hardware for emulation, extensions, and debugging. Explore different tools and interfaces for effective debug processes.

ARM Debug Architecture with JTAG and Multi-ICE Speaker
E N D
Presentation Transcript
JTAG and Multi-ICE Speaker :沈文中
ARM debug Architecture Content of JTAG Content of Embedded ICE Multi-ICE Arch. Outline
AXD can debug design through: ARMulator(software) Multi-ICE(hardware) Angel(hardware) ARM debug Arch.(I)
Limits of ARMulator Processor core model Memory interface Coprocessor interface Operating system interface ARM debug Arch.(II)
Multi-ICE The solution for ARMulator limits Can emulate custom logic Use hardware to emulate truly results Extended from JTAG Architecture ARM debug Arch.(III)
ARM debug Architecture Content of JTAG Content of Embedded ICE Multi-ICE Arch. Outline
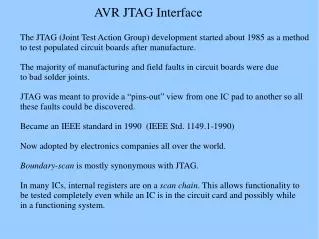
Serial scan path from one cell to another Controlled by TAP controller JTAG Arch.
JTAG Signals TRST Test reset signal TDI Test data in TMS Test mode select TCK Test clock TDO Test data out JTAG Principle(II)
ARM debug Architecture Content of JTAG Content of Embedded ICE Multi-ICE Arch. Outline
The extensions consist of a number of scan chains around the processor core and some additional signals that are used to control the behavior of the core for debug purposes : BREAKPT: enables external hardware to halt processor execution for debug purposes.active high DBGRQ: is a level-sensitive input that causes the CPU to enter debug state when the current instruction has completed. DBGACK: is an output from the CPU that goes high when the core is in debug state Debug extensions to the ARM core
This logic is the integrated onchip logic that provides JTAG debug support for ARM core. This logic is accessed through the TAP controller on the ARM core using the JTAG interface. Consists of: Two watchpoint units A control register A status register A set of registers implementing the Debug Communications Channel link The EmbeddedICE logic
Watchpoints are taken when the data being watchpointed has changed. Breakpoints are taken when the instruction being breakpointed reaches the execution stage. the program counter is not updated, and retains the address of the breakpointed instruction. Watch /break point
ARM debug Architecture Content of JTAG Content of Embedded ICE Multi-ICE Arch. Outline
Multi-ICE(II) • Debugging software can be run on different computer through Network.
To support network connections, an additional application must be running on the windows workstation that runs the The multi-ICE server. The portmap application • the portmapper allows software on other computers on the network to locate the The multi-ICE server.
A debug monitor is an application that runs on your target hardware in conjunction with your application, and requires some resources(ex:memory) to be avaible The EmbeddedICE debug arch. Requires almost no resources. Rather than being an application on the board, it works by using : Additional debug hardware within the core, parts that enable the host to communicate with the target An external interface unit that buffers and translates the core signals into something usable by a host computer How multi-ICE differs from a debug monitor
Multi-ICE [DUI_0048F_MICE2_2_UG] AXD and armsd Debuggers Guide [DUI_0066D_AXDDG_2_UG ] Getting Started Guide [DUI_0064D_GSG_UG ] Reference Topic & Related Documents