Dr. David Crisp
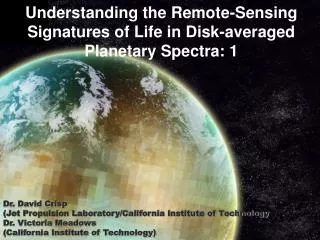
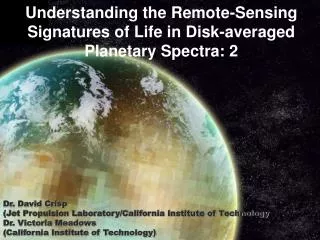
Understanding the Remote-Sensing Signatures of Life in Disk-averaged Planetary Spectra: 3. Dr. David Crisp (Jet Propulsion Laboratory/California Institute of Technology Dr. Victoria Meadows (California Institute of Technology). Exploring Terrestrial Planet Environments. Modern Earth


Dr. David Crisp
E N D
Presentation Transcript
Understanding the Remote-Sensing Signatures of Life in Disk-averaged Planetary Spectra: 3 Dr. David Crisp (Jet Propulsion Laboratory/California Institute of Technology Dr. Victoria Meadows (California Institute of Technology)
Exploring Terrestrial Planet Environments • Modern Earth • Observational and ground-measurement data • Planets in our Solar System • Astronomical and robotic in situ data • The Evolution of Earth • Geological record, models • Extrasolar Terrestrial Planets • Models, validation against Solar System planets including Earth.
The Earth’s Primordial Atmosphere • Our primordial atmosphere was created by “outgassing” from molten rock prior to 200 Myr • 40Ar/36Ar in our present atmosphere indicates that core formation, and release of gases, took no more than a few 10s of millions of years. • This released most of the water vapor and gases (CO2, N2, and H2S or SO2). • Earth would have initially had a steam atmosphere • As the planet cooled, this condensed to produce our oceans and atmosphere. • Impacts may also have delivered volatiles directly to the surface after the Earth formed. • However, the D/H ratio in comets is too high to have supplied most of the earth’s oceans.
The Faint Young Sun Paradox The Sun today is considered to be 30% brighter than it was 4.6Ga. • And yet, the Earth’s surface temperature has been maintained within the tolerance limits of living organisms for more than 3 billion years, despite substantial changes in solar luminosity Kasting et al., Scientific American (1988)
Planetary Evolution N2 O2 CO2 CH4 TPF/Darwin and LifeFinder will be able to observe planetary systems at different stages of evolution ? N2 CO2 CH4
Earth’s Prebiotic Atmosphere • Dominantly N2 and CO2 • < 10bars CO2 prior to continents (<~300Myrs) • 0.1-0.3 bars CO2 required to offset the faint young Sun • H2 and CO from impactors, volcanism • H2 concentration determined by balancing volcanic outgassing with escape to space • Abiotic net source of O2 • Photolysis of H2O and CO2 , and escape of H to space • But O2 would have reacted with reduced volcanic gases to form CO2 and H2O • High-altitude O2 source: Photolysis of CO2 followed by O + O + M O2 + M
Weakly Reducing Early Atmosphere J. F. Kasting, Science (1993) The Earth’s Prebiotic Atmosphere was a “weakly reducing atmosphere”. It contained small concentrations of reduced gases and almost no free O2 NB: This would not have supported prebiotic synthesis via CH4 and NH3
The Archean Atmosphere • Life arose by at least 3.5Gya • Evidence from microfossils and stromatolites. • Possible evidence for life at 3.8Gya from 13C depletion • The Earth was inhabited - but the atmosphere was anoxic (no O2) prior to ~2.3 Gya • Photosynthesis may have been invented, but originally used H2S (or H2) to reduce CO2 • Not H2O, as used today, so no O2 production! • Even oxygenic photosynthesis would not have immediately produced an O2-rich atmosphere. • O2 would have been consumed by reduced atmospheric gases or reduced surface materials.
Life and Archean Methane • Methane may have become abundant soon after life arose • Abiotic methane is produced by outgassing from mid-ocean ridge hydrothermal vents • The potential biotic source of CH4 is much larger • RNA sequencing indicated that some methanogens are very ancient. • Methanogenic bacteria can use CO2 + 4H2 CH4 + 2H2O • Could have produced 1000ppm of CH4, globally • Longer lifetime because no O2! • Many ramifications for Archean climate • Helps solve the faint young Sun problem (provided 15C of warming). • But warming would drive down CO2 • Rapid loss of CH4 via an oxygenated atmosphere may have triggered an ice-age
The Rise of O2 • Somewhere around 2.3Ga, O2 levels in the atmosphere rose dramatically • Geological evidence includes • Banded iron formations, formed in an anoxic ocean, mostly found more than 1.8 Gya (but 0.6-0.8Gya also…during widespread glaciation) • Detrital Uraninite and Pyrite • Found prior to 2.3Ga and could only have been weathered in an O2 poor atmosphere • Paleosols and Redbeds • Most paleosols prior to 2.2Gya have lost iron • Fe released during weathering in an O2 poor atmosphere would have been leached away. • Redbeds indicate oxidizing atmospheric conditions at the time of their formation. • Earliest found 2.2Gya. • Sulfur Isotope Data
Earth’s Evolution as a Terrestrial Planet • The formation of an atmosphere containing N2 and CO2 and an H2O ocean appears to be a natural consequence of planetary accretion. • Numerous sources of geological evidence point to atmospheric O2 levels being low prior to ~2.3 Ga • O2 levels rose naturally, but not immediately as the result of photosynthesis and organic carbon burial • Explaining why O2 first rose at 2.3 Ga while cyanobacteria arose prior to 2.7 Ga is still an ongoing task • An effective ozone screen against solar UV radiation was established by the time pO2 reached ~0.01 PAL • Many of these general conclusions imply that Earth may not be unique.
Modern Earth 355ppm CO2 V. Meadows
Atmosphere from Climate Models by Pavlov et al., 2004 Proterozoic 0.1PAL O2 100ppm CH4 15% decrease in ozone column depth Meadows, Kasting,Crisp,Cohen V. Meadows
Atmosphere from Ecosystem Models by Karecha et al., 2005 Archean N2 99.8% 2000ppm CO2 1000ppm CH4 100ppm H2 Karecha, Kasting, Segura, Meadows, Crisp, Cohen
Earth’s Reflectivity Through Time O3 ARCHEAN PROTEROZOIC MODERN Rayleigh Scattering O2 CH4 H2O CO2 CO2 CH4 H2O H2O CH4 H2O O2 V. Meadows
Earth Through Time - Biosignatures CH4 • In the MIR, Mid-Proterozoic Earth-like atmospheres show strong signatures from both CH4 and O3 • In the visible, the O2 absorption is reduced, but potentially detectable, CH4 is probably less detectable for the mid-Proterozoic case. O3 O2 CH4 V. Meadows IAUC200: Kaltenegger et al., Tuesday, Session V
The Evolutionary Trajectories of Super Earths (some speculations!) • A more massive planet would have a longer geothermal lifetime • If it rotates, it could maintain a dynamo and a significant magnetosphere longer than a much smaller planet • Outgassing (and tectonic processes) would continue for a longer time • A larger planet would maintain more of its lighter volatiles longer (for better or worse) giving an ecosystem longer to evolve • Planetary differentiation processes may contribute to the environment in unpredictable ways as a function of planetary mass (ie different materials may be sequestered in the core) • Differentiation affects formation of continents • continental weathering provides a source of phosphorus, • continents increase mixing within an ocean basin
Lessons from the Earth Through Time • How much O2 was present prior to the origin of life? • What did the Earth look like at that time? • When did oxygenic photosynthesis evolve? • When did atmospheric O2 first become abundant? • What exactly caused the rise of O2? • When did ozone become abundant enough to provide an effective solar UV screen?
Exploring Terrestrial Planet Environments • Modern Earth • Observational and ground-measurement data • Planets in our Solar System • Astronomical and robotic in situ data • The Evolution of Earth • Geological record, models • Extrasolar Terrestrial Planets • Models, validation against Solar System planets including Earth.
Modeling Planetary Environments: The Virtual Planetary Laboratory Observer The Virtual Planetary Laboratory (VPL) is a numerical model developed to • Simulate a broad range of planetary environments. • Planets other than Earth, around stars other than our Sun. • Include abiotic and inhabited planets • Oxygen/non-oxygen producing life • Generate realistic full-disk spectra that cover a broad range of wavelengths • ultimately provide a comprehensive, flexible tool which can be used by a broader community. Synthetic Spectra Atmospheric and surface optical properties Task 1: Spectra Radiative Transfer Model Task 2: The Climate Model (SMARTMOD) Stellar Spectra Radiative Fluxes and Heating Rates Atmospheric Thermal Structure and Composition Task 3: The Coupled Climate-Chemistry Model Climate Model UV Flux and Atmospheric Temperature Atmospheric Composition Task 4: The Abiotic Planet Model Atmospheric Chemistry Model Task 5: The Inhabited Planet Model Atmospheric Thermal Structure and Composition Atmospheric Escape, Meteorites, Volcanism, Weathering products Virtual Planetary Laboratory Exogenic Model Geological Model Atmospheric Thermal Structure and Composition Biological Effluents Biology Model
VPL Architecture The VPL simulates equilibrium planetary environments as an initial value problem by marching forward in time from an assumed initial state. It includes a series of modules that share environmental data through a common database as they progress through each time step Initialize Major Time Step Loop Chem DB EP DB Geo DB Exogenic Process Geology Chemistry Translator Translator Translator EP Input Geo Input Geo Output EP Output Chem Input Chem Output Common Database Translator Clim Input Clim DB Bio DB Climate Final Spectrum Biology Translator Translator Convergence ? Conv Input Bio Output Bio Input Clim Output
Thermodynamically Balanced Planets Atmospheric Composition Thermal Radiation Cloud Stellar Radiation Convection Goal: Investigate spectra of planets in thermodynamic equilibrium • Why a climate model? • Climate affects a planet’s reflected and emitted spectrum • Climate will change with • stellar type • orbital distance • A Simple Climate Model • One Dimensional (vertical) • Three heat transport Processes • Radiative Transfer • Solar heating • Thermal cooling • Vertical Convection • Latent heat • Cloud condensation, evaporation, precipitation Initial Guess Altitude Final Profile T
VPL Climate Model Atmospheric Composition Thermal Radiation Cloud Stellar Radiation Convection A 1-dimensional climate model is being developed to simulate the environments of plausible extrasolar terrestrial planets. • provides only a globally-averaged description of the planet’s surface temperature and atmospheric thermal structure • Includes all physical processes that contribute to the vertical transport of heat and volatiles throughout the atmospheric column • Radiative heating and cooling rates: Comprehensive, spectrum-resolving model of the solar and thermal fluxes and radiative heating rates in realistic scattering, absorbing, emitting planetary atmospheres • Vertical convective heat and volatile transport: Mixing length formulation based on a state-of-the-art planetary boundary layer model (U. Helsinki) • Diffusive heat transport: Diffusive heat transport within the surface and near-surface atmosphere, and within the exosphere is simulated by a multi-layer vertical heat diffusion model • Latent heat transport: A versatile cloud/aerosol model that simulates airborne particle nucleation, condensation, evaporation, coagulation, and precipitation of any species identified as an active volatile or passive aerosol (dust) in the climate system • Equilibrium climate derived by solving the vertical heat/volatile transport equation as an initial value problem, starting from an assumed state
Model Atmospheres T • 1-Bar “Earth-like” atmospheres • vary O2 from present atmospheric levels (20.99%) to 1x10⁻⁵ of its present-day values. (Krelove and Kasting) • Atmospheric T and composition were allowed to evolve to a near-equilibrium state at 1 AU from a solar-like (G2) star. • Abundance of O3,H2O, CH4 and N2O decrease with O2 abundance • Particularly in the stratosphere • Stratospheric temperatures cooled substantially with loss of ozone O3 CH4 H2O N2O V. Meadows
F, G, K Planet Spectra F2VG2V K2V O3 O3 CO2 O2 • Very little change in the visible (except O3) • MIR shows changes in CH4, O3, and CO2 • F2V planet has 2x O3 column depth • K2V planet at 1PAL same surface flux, more atm CH4 (Results published in Segura et al., Astrobiology, 2003, 3, 689-708.). CH4
Relative Detectability of CO2, O3 and CH4 F2V planet at 1PAL - 2X O3 column depth K2V planet at 1PAL - same surface flux, more atm CH4 Segura et al., 2005,
Ozone and Temperature at Different O2 Levels Absorption of UV radiation by O3 heats the stratosphere, and temperature affects ozone chemistry, so the most accurate calculations consider both photochemistry and temperature Photochemical model Radiative-convective climate model Calculations by Kara Krelove Graphs by Darrell Sommerlatt
Masking and Exaggerating Biosignatures T O3 O3 variations vs O2 Concentration O2 Absorption at visible wavelengths • Equilibrium environments with reduced O2 have • Less stratospheric ozone • Lower stratospheric temperatures • Less ozone heating • Strong 9.6 m O3 band • Less stratospheric emission • 0.01xPAL O2 case almost indistinguishable from 1xPAL case Temperature vs. O2 Concentration O3 Absorption at Thermal wavelengths Thermal IR observations of O3 alone will not provide quantitative constraints on O2
Ozone column depth vs.pO2 • Why the nonlinearity? • O2 + h O + O • O + O2 + M O3 + M • As O2 decreases, O2 • photolysis occurs lower • down in the atmosphere • where number density • (M) is higher Kasting et al. (1985)
O2 and O3 detectability vs O2 abundance K Star G Star F Star Earth-like planetary spectra at different O2 abundances around different stars - look similar in the visible – O2 most detectable down to 10-2 PAL - are similar in the MIR for G and K stars - O3 most detectable down to 10-3 PAL of O2 - quite different for F stars, which are most sensitive to 10-1 – 10-2 PAL of O2
Clouds, Thermal Structure and The Detectability of Biosignatures PAL • High-altitude clouds • Mask surface albedos and temperatures • Dramatically reduce the spectral strength of the ozone and CO2 bands Cloudy planets hide their secrets (Krelove, Kasting, Crisp, Cohen, Meadows) 0.01 O2
Planets Around M Stars O3 N2O O2 photolysis If a planet had O2, would O3 form? Segura, Kasting, Meadows, Cohen Crisp, Tinetti, Scalo
Active M Star Planets Earth N2O AD Leo planet CH4 O3 + CH3Cl H2O CO2 Segura et al., Astrobiology, 2005.
Active M Star Planets Earth AD Leo planet O3 O2 CH4 CH4 O2 CO2 CH4 H2O H2O H2O H2O Segura et al., Astrobiology, 2005.
Conclusions • planets in our Solar System are a good starting point, but • terrestrial planets may be larger in the sample that TPF finds. • terrestrial planets may exist in planetary systems very unlike our own • Modeling will be required to interpret the data returned from TPF-C, TPF-I and Darwin • To explore a wider diversity of planets than those in our Solar System • To help interpret and constrain first order characterization data
The Virtual Planetary Laboratory Team • The NAI’s Virtual Planetary Laboratory (VPL) Team is an example of the highly interdisciplinary team needed to • Assess detectability of biosignatures on extrasolar planets • Support the development of TPF and future missions to search for life in the universe.