Download
1 / 19
220 likes | 1.06k Vues
Understand how the body metabolizes blood sugar through the Glucose Tolerance Test. Learn about diabetes diagnosis and insulin performance assessment in this laboratory method. Detailed procedure and results interpretation provided.

E N D
Background • Blood glucose is regulated in large measure by two pancreatic hormones, insulin and glucagon. Both are peptides secreted by the pancreas (as an “endocrine function”) in response to changes in blood glucose outside of its normal physiological range, and both cause biological changes in distant target cells. • Insulin stimulates blood glucose uptake by body tissues, which functionally will reduce blood glucose levels. When the muscles and liver take up blood glucose, and extra blood glucose not needed for cell metabolism can be converted to a storage form of glucose called glycogen
Diabetes mellitus Diabetes mellitus is a disorder of fuel metabolism. The two major syndromes are classified as • Type I diabetes (formerly insulin-dependent diabetes mellitus) IDDM • Type II diabetes (formerly non-insulin-dependent diabetes mellitus NIDDM and more recently referred to as “insulin resistance” • Both are characterized by hyperglycemia (high blood glucose) and inability to properly metabolize glucose. • In someone suffering from diabetes - the blood is overloaded with glucose, but tissues starve as they are unable to use it.
Clinical significance • To assess insulin performance, clinicians use the oral glucose tolerance test (OGTT)
WHAT IS A GLUCOSE TOLERANCE TEST? • It is a laboratory method to check how the body breaks down (metabolizes) blood sugar, and how quickly it is cleared from the blood. • The test usually used to test for diabetes, insulin resistance, impaired beta cell function and reactive hypoglycemia.
Preparation • The patient is instructed not to restrict carbohydrate intake in the days or weeks before the test. • The test should not be done during an illness, as results may not reflect the patient's glucose metabolism when healthy. • Usually the OGTT is performed in the morning as glucose tolerance can exhibit a diurnal rhythm with a significant decrease in the afternoon. • The patient is instructed to fast (water is allowed) for 8–12 hours prior to the tests
Procedure • A zero time (baseline) blood sample is drawn. • The patient is then given a 75g of glucose in a 300 ml solution and drink within a 5-minute time frame. • Blood is drawn every 30 min for 2 hr to measure of glucose (blood sugar), and sometimes insulin levels. The intervals and number of samples vary according to the purpose of the test. For simple diabetes screening, the most important sample is the 2 hour sample and the 0 and 2 hour samples may be the only ones collected.
Results A- Fasting plasma glucose (measured before the OGTT begins) should be below (110 mg/dL) innormalperson. • Fasting levels between (110 and 125 mg/dL) indicate pre-diabetes )Impaired glucose tolerance) . • Fasting levels repeatedly at or above (126 mg/dL) are diagnostic of diabetes. B- 1 hour GTT (Glucose Tolerance Test) glucose level below (180 mg/dL) is considered normal. C- 2 hour GTT (Glucose Tolerance Test) glucose level below (140 mg/dL)is normal. • Blood plasma glucose between (140 mg/dL) and (200 mg/dL) indicate "pre-diabetes. • Blood plasma levels above (200mg/dL)at 2 hours confirm a diagnosis of diabetes.
A curve is plotted with the blood glucose levels on the vertical axis against the time of collection on the horizontal axis. • The curve so obtained is called glucose tolerance curve.
i) Fasting blood glucose (Zero hour sample)- is 90 mg /dl, which is well within the normal range (Normal 60-100 mg/dl). ii) There is rise of blood glucose after glucose load and the peak value is observed at 1 hour. This is due to absorption of glucose from the intestine. iii) The blood glucose level return to the fasting level within 2hour. iv) Glucose is not found in the urine samples. 12
Blood glucose (mg/dl) Time in minutes
Fasting blood glucose is higher than normal • The highest value is attained at 1 hour to 1 hour 30 minutes. • Glucose is found in almost all the urine samples. • The blood glucose level does not return to the fasting level even within 2hour 30 minutes.
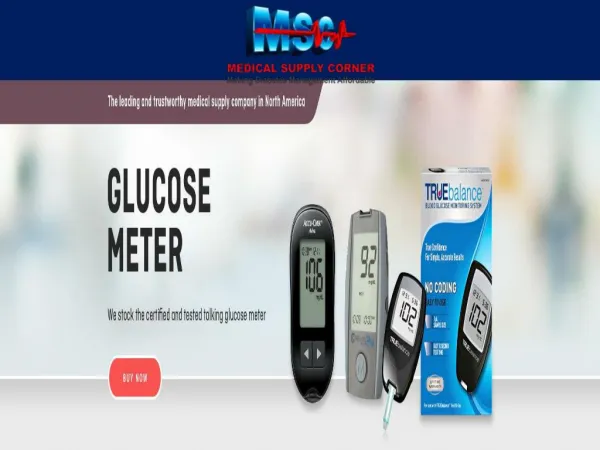
Materials Each group requires a pen-prick with lancets, glucose strips, a digital glucose-meter.
Methods of Measurement • Obtain a droplet of blood from a finger by lancing. [It helps if you squeeze your fingertip to trap blood first before using the lancet.] A partner can prepare the glucose-meter by placing a strip in the meter. • When the droplet appears on the LCD, apply the blood drop to the end of the glucose strip (not on top of the strip) • An infrared light scans the strip and in a matter of 5-6 seconds, blood glucose is indicated on the screen in mg/dL. • After this first (Time 0) reading, drink a roughly 350 mL serving of one of the beverages provided, then record blood glucose at 30, 60 and 90 minutes afterwards. • Record data for yourself and your labmate in the table below.