NORTH
NORTH. PLATFORM HOGAN. EARTHVISION VIEW OF 2005 PLATFORM HOGAN REDRILL PROGRAM LOOKING NORTHWEST PRE-EXISTING HOGAN WELLS IN PURPLE. HOBSON FAULT TRACE. A40ST1. A26ST1. A40ST2. A52ST1. A46ST1. A18ST2. A1ST1. A6ST2. G7X STRUCTURAL SURFACE. 2005 Redrill Program.

NORTH
E N D
Presentation Transcript
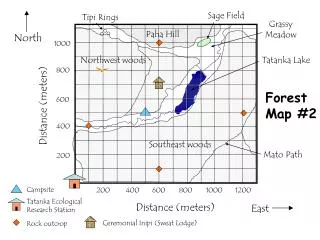
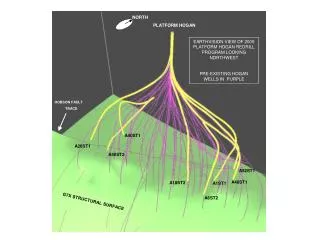
NORTH PLATFORM HOGAN EARTHVISION VIEW OF 2005 PLATFORM HOGAN REDRILL PROGRAM LOOKING NORTHWEST PRE-EXISTING HOGAN WELLS IN PURPLE HOBSON FAULT TRACE A40ST1 A26ST1 A40ST2 A52ST1 A46ST1 A18ST2 A1ST1 A6ST2 G7X STRUCTURAL SURFACE
2005 Redrill Program EarthVision perspective view showing 2005 redrill program wells (yellow) in relation to pre-existing Phillips wells and POOI 1998 redrill program (purple). View looks toward the northwest from above and to the southeast of Platform Hogan. All rocks above zone G7X have been removed from the display to allow examination of the well configurations. The general configuration of the structural surface is indicated by shading of the G7X surface. The Hobson Fault trace is labeled. 2005 program wells are labeled for reference to up-coming discussions in this presentation.
SUPRA-THRUST BLOCK FMI fault image UPPER F-ZONES A40ST1 A40ST2 HOBSON FAULT LOWER G-ZONES
A40ST1 – A40ST2 Cross Section Cross-section slice of EarthVision Model showing relation of the 2005 A40 redrills to the geologic configuration above and below the Hobson Fault on the north flank of the Carpinteria anticline. View looks west. The A40ST1 was designed to test the possibility of substantial reserves trapped in upper and middle F-zones below the Hobson Fault, analogous to known sub-Hobson hydrocarbon entrapment in deeper G-zones. This well proved to be a wet test (“dry hole”), lacking trapped hydrocarbons. The well was re-drilled as the A40ST2, which proved to be very successful in finding hydrocarbons in the lower G-series sands below the Hobson Fault. Although the A40ST1 was an unsuccessful test, the ability to re-drill the well into known hydrocarbons resulted in an economically efficient test of the F-zone trap hypothesis. Fomation MicroImager imaging of the Hobson Fault interval in A40ST1 and A40ST2 showed the Hobson Fault to consist of a 7’ thick zone and that the nature of the rocks within the fault zone may have precluded hydrocarbon trapping in the upper F-zones. Subsequent slides will discuss this in more detail.
A40ST2 FORMATION MICROSCANNER IMAGE HOBSON FAULT INTERVAL
Formation MicroImager image of Hobson Fault Plane This slide shows the FMI resistivity image of the Hobson Fault plane encountered in A40ST2. The FMI works by recording the electric resistance (resistivity) values of the borehole wall using a six-arm logging tool with multiple recording buttons per arm. The result is an image of the borehole wall with a resolution approximating one inch in which the high-resistivity layers are shown as dark while the low-resistivity layers are shown as light. The dip and strike of any layer can be calculated from the display shown in the right panel. The left panel shows a 3-D representation of the resistivity image as though one were looking at a core sample of the well. The exact nature of the Hobson Fault zone could not be interpreted at this level of detail without data of this resolution. The image within the Hobson Fault zone shows several low-resistivity (light) layers which calculate to be at a slight oblique angle to the orientation of the bounding edges of the fault zone itself. This angularity could allow the migration of hydrocarbons from one side of the fault zone to the other along these layers. If the rocks on the upthrown side of the Hobson fault are permeable sandstones, as is the case opposite the subthrust upper F-zones, it would be possible for oil to migrate across the fault and into the overlying rocks, bypassing the location of the A40ST1 well bore. Thus oil would not be trapped under the Hobson Fault in settings where sandstones are present across the fault in the upper block. Where the rocks above the Hobson are not permeable, as is the case with the lower G-zones of A40ST2, migration through the fault plane would not matter because the oil would be trapped against the overlying, non-permeable rocks. Given this new data on the nature of the fault, this interpretation is consistent with the results of the A40 redrill program and other data. Unless new data to the contrary is discovered, it would not be reasonable to propose further subthrust F-zone exploration in this area.
“5354” FAULT FMI IMAGE LOWER G-SERIES “5354” FAULT A40ST2
EarthVision Cross Section showing A40ST2 This slide is an expanded version of a previous slide to show the geologic detail in the vicinity of the A40ST2 redrill. This well penetrated the Hobson Fault and entered sediments of the G5S and older zones. Excellent hydrocarbon saturations were encountered, including significant amounts of natural gas. The green-colored interval overlying the fault-terminated ends of the subthrust lower G-series zones represents the low permeability, hydrocarbon trapping rocks discussed previously. The FMI log of this well indicated a second fault, here designated as the “5354” fault for the depth at which it was encountered in the A40ST2 borehole. Because we can determine the strike and dip of faults using the FMI log, it is possible to project and map the extent of the fault plane. As will be discussed further later on, it is probable that the “5354” fault is at least partly responsible for entrapment of the hydrocarbons discovered by the A40ST2 well.
A40ST2 FORMATION MICROSCANNER IMAGE “5354” FAULT IMAGE
Formation MicroImager image of “5354” Fault Plane This slide shows the same display as that for the Hobson Fault, shown earlier. Here, the right panel shows the well bore image of a shale interval centered on 5354 feet in the A40ST2 well. The information in the cylindrical image is shown on the flat page as though the cylinder had been sliced lengthwise and opened up to show the interior. Inclined planes passing through the well bore cylinder appear on the right panel as sine-wave shaped images. The sine-wave (or “sinusoid”) at 5354 ft is the image of the “5354” fault plane. This image calculates to have a dip of 41 degrees oriented in the 173deg azimuth direction, or 7 degrees east of south.
EARTHVISION MODEL SHOWING SUBTHRUST CONFIGURATION OF A40ST2 AND PORPOSED OFFSETS HOBSON FAULT SURFACE (GRAY) UPPER F-SERIES LOWER G-SERIES A36ST1 A40ST2 A21ST1 A53ST1
EarthVision view of A40ST2 and Proposed Offset Locations To help visualize an up-coming map, this EarthVision view shows the A40ST2 and it’s proposed offset locations as though one were looking down onto the surface of the Hobson Fault. The overlying rocks have been removed, as have some of the subthrust intervals in order to show the prospective zones. The Hobson Fault plane, itself, is rendered as light grey. In order to be able to compare the locations of the different wells, the rocks within the zones of interest have been rendered transparent. The A40ST2 well and each of its offset wells enter the target section through the Hobson Fault at or near zone G5S, after which they each drill progressively deeper into the target section, always remaining below the Hobson Fault. Although it has not yet been incorporated into the model, the “5354” fault, noted earlier, would project onto the Hobson fault surface, running left to right just below the point where the various offset locations penetrate the Hobson Fault.
EARTHVISION VIEW 2006 SUBTHRUST REDRILL PROGRAM WELLS IN RELATION TO “5354” FAULT “5354” FAULT LOWER G-SERIES
EarthVision View of A40ST2 Offset Wells from Side Rotation of previous view to show relationship of A40ST2 offset wells to Hobson and “5354” faults. The A40ST2 was drilled with an inclination angle of 22 degrees from the vertical. Offset wells are planned with inclinations of 35 to 40 degrees to gain maximum structural advantage in the dipping subthrust zones while minimizing operational difficulties which can occur with more highly inclined wells.
Structure Contour Map on Zone G7S This map shows the relationship of A40ST2 and the proposed offset redrills projected onto a structure contour map of the G7S surface. A structure contour map represents the configuration of a surface using a series of equally spaced lines of equal elevation. Examination of the values of the structural contours on this map shows the surface to be dipping approximately 20 degrees to the north. The contours terminate to the south where they are cut off by the Hobson thrust fault. This relationship can be visualized by referring to the “side” view EarthVision image two slides earlier. Similar contour maps can be generated for each zone of interest allowing detailed two-dimensional structural analysis without the need to continuously update the 3-D model. Prospective sections of the A40ST2 and the proposed offset wells have been projected onto the G7S structural surface, from G5S to the base of the G7S zone (horizon G7SX) and to total depth. This allows comparison of distances between the offset redrills and pre-existing wells to analyze issues of interference between the various wells. The offset wells have been laid out so that none are closer than 200 feet from each other and so that all are at least 150 feet from pre-existing wells which may have some level of previous fluid depletion. This distribution yields the greatest probability that each of the offset redrills will have the most remaining saturation possible.
Proposed Platform Houchin Redrill Program This slide shows a map of the F-1 Zone top derived from the EarthVision 3-D model. Pre-existing wells spots are color coded to show their original saturation status. Fourteen redrill opportunities have been identified at Platform Houchin. These are colored in magenta on this map. During the preparation period before moving onto Platform Houchin, these locations will be studied in great detail and prioritized. Early drilling results will, of course, will determine which subsequent locations will be drilled. Some of these or other wells may be drilled as horizontal or nearly horizontal wells, depending on the results of pilot drilling in individual fault blocks.
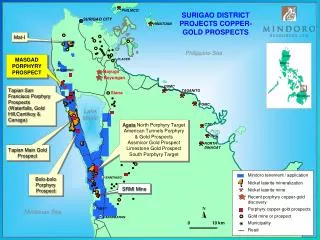
Map of Net Hydrocarbon Feet, Lease p 0166 This map shows the distribution of net hydrocarbon feet (net-H) revealed by the initial Phillips drilling program on Lease P 0166. Net hydrocarbon feet is a calculated parameter that relates the original hydrocarbon richness at a location reported as vertical feet of oil. Of course, thicknesses of pure oil don’t actually exist in a real well. Oil is found saturating the pore space of sandstone rocks distributed in various discrete layers within the well bore. Net-H is calculated by adding the number of vertical feet of oil saturated sandstone found in a given well, then subtracting everything in that total thickness that cannot be sold as oil. That includes small shale layers, sand grains and clay particles that make up the sandstone reservoir rocks, and water that is always present to some degree in the pore space along with the oil. These values are determined from analysis of the well logs that were recorded at the time the wells were drilled. The result is expressed as a physically impossible but comparatively useful number dimensioned as vertical feet of pure oil. On the map, areas of high net-H are shown in yellow and low net-H in blue. The yellow areas may be thought of as those areas that were originally richest in oil when the field was first drilled. This map suggests that the area of the field around Platform Houchin was originally richer in oil than was the area around Platform Hogan where we have been drilling in the current program. Also shown are red circles that are proportional to the amount of oil that has been withdrawn to date by existing wells. Larger circles indicate more oil has been produced. Obviously, where small red circles are present in yellow areas, the inference can be made that much oil remains to be produced. On this basis, the Houchin area appears highly prospective.