Download
1 / 34
340 likes | 548 Vues
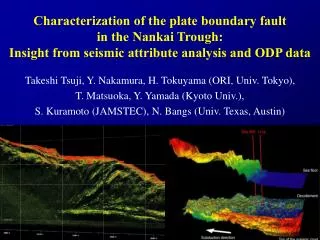
Characterization of the plate boundary fault in the Nankai Trough: Insight from seismic attribute analysis and ODP data. Takeshi Tsuji, Y. Nakamura, H. Tokuyama (ORI, Univ. Tokyo), T. Matsuoka, Y. Yamada (Kyoto Univ.), S. Kuramoto (JAMSTEC), N. Bangs (Univ. Texas, Austin).

E N D
Characterization of the plate boundary fault in the Nankai Trough: Insight from seismic attribute analysis and ODP data Takeshi Tsuji, Y. Nakamura, H. Tokuyama (ORI, Univ. Tokyo), T. Matsuoka, Y. Yamada (Kyoto Univ.), S. Kuramoto (JAMSTEC), N. Bangs (Univ. Texas, Austin)
Background & Purpose • Physical properties along the decollement are important for understanding the deformation features and earthquake mechanism. • DSDP/ODP provided a significant amount of data, however they are 1D data at the drilling site only. • Thus, development of a method to obtain physical properties from 3D seismic reflection data is important. • To investigate physical properties along the decollement, seismic attributes analysis via neural network was applied to 3D seismic reflection data off Muroto Peninsula. • Our research represents a first application of the analysis to a decollement. International Workshop on Core–Log–Seismic Integration, 2005
Work flow International Workshop on Core–Log–Seismic Integration, 2005
Step 1 : 3-D seismic reflection data International Workshop on Core–Log–Seismic Integration, 2005
Survey area Survey area: Nankai Trough off Muroto 3-D data(80km×9km) was obtained by the R/V Ewing in 1999. Acquisition system ・Streamer cable Length : 6 km Channel number : 240 Channel interval : 25 m ・Airgun system Tuned airgun Total volume : 70 ℓ International Workshop on Core–Log–Seismic Integration, 2005
Seismic profile Study area International Workshop on Core–Log–Seismic Integration, 2005
Two-way time [ms] Landward Inline direction Seaward 3-D seismic reflection data International Workshop on Core–Log–Seismic Integration, 2005
ODP Site Landward Inline direction Seaward Geometry of the seafloor International Workshop on Core–Log–Seismic Integration, 2005
Our purpose is to delineate the physical properties along this horizon. Two-way time [ms] Landward Inline direction Seaward Geometry of the décollement International Workshop on Core–Log–Seismic Integration, 2005
Ridge and trough features exist parallel to the subduction direction. Two-way time [ms] Landward Inline direction Seaward Geometry of the surface of oceanic crust International Workshop on Core–Log–Seismic Integration, 2005
Step 2 : Computation of seismic attributes International Workshop on Core–Log–Seismic Integration, 2005
Seismic attributes Seismic attributes are all the information obtained from seismic data. ・Envelope ・Time derivative of envelope ・Second derivative of envelope ・Instantaneous phase ・Instantaneous frequency ・Instantaneous bandwidth ・Q-value ・Relative acoustic impedance ・Semblanceetc International Workshop on Core–Log–Seismic Integration, 2005
Computation method of basic attributes Complex trace F(t) f(t) : Real part of the complex trace, corresponding to the recorded seismic data g(t) : Imaginary part of the complex trace ・Envelope g(t) ・Instantaneous phase ・Instantaneous frequency f(t) Taner et al. (1979)
Comparison of 1D seismic attributes International Workshop on Core–Log–Seismic Integration, 2005
H 0 Two-way time [s] Envelope A(t) + 0 - Two-way time [s] Original seismic profile
180 0 -180 Two-way time [s] Instantaneous phase θ(t) + 0 - Two-way time [s] Original seismic profile
H L Two-way time [s] Instantaneous frequency ω(t) + 0 - Two-way time [s] Original seismic profile
Computation of Q-value Amplitude spectrum on time-frequency domain Q-value is much affected by the underground physical properties. Q-value can be calculated from the amplitude spectrum (A1 and A2) and dominant frequency. International Workshop on Core–Log–Seismic Integration, 2005
H L Two-way time [s] Q-value + 0 - Two-way time [s] Original seismic profile
H L Two-way time [s] Semblance + 0 - Two-way time [s] Original seismic profile
Step 3 : Classification of the décollement via SOM International Workshop on Core–Log–Seismic Integration, 2005
When we assume the regions with acoustically similar features have similar properties, the classification result represents the variation of physical properties along the decollement. Kohonen self-organizing map (SOM) When several attributes input to the SOM, it classifies the seismic data into several regions with acoustically similar features. International Workshop on Core–Log–Seismic Integration, 2005
Selection of attributes ① Envelope ② Instantaneous frequency ③ Q-value ④ Semblance Since selected attributes have low cross-correlation, they have different acoustic properties. International Workshop on Core–Log–Seismic Integration, 2005
Classification result along the décollement by means of SOM (Region of the same color has the similar physical properties) International Workshop on Core–Log–Seismic Integration, 2005
Physical properties along the decollement change at the sole of the proto-thrust. Landward class Seaward class International Workshop on Core–Log–Seismic Integration, 2005
Step.4 Geological interpretation 1. ODP data 2. Geometry of the decollement International Workshop on Core–Log–Seismic Integration, 2005
Geological interpretation 1.ODP data (Site 1174 & 808) At Site 1174, the porosity changes little across the decollement by comparison to Site 808, where porosity increase from ~30% above the decollement to ~40% below it. The offset of the porosity represents the high pore pressure below the decollement (Screaton et al., 2001). At the landward class, the pore pressure may increase. The fault zone becomes thin (sharp) at Site 808, comparing to Site 1174. International Workshop on Core–Log–Seismic Integration, 2005
SOM classification result may represent the initiation of the slip. Geological interpretation At the landward class 1. Increase of the overburden to the decollement 808 1174 2. High pore pressure → Offset of the porosity 3. Initiation of the slip due to less frictional coefficient. → Sharpness of the decollement Seismic profile Above interpretation coincides with structural interpretation that the slip initiates from the point where shear stress along the decollement release to the seafloor. Frontal-thrust Proto-thrust 2 km International Workshop on Core–Log–Seismic Integration, 2005
offset Geological interpretation2.Geometry of the decollement Two-way time [s] Inline direction International Workshop on Core–Log–Seismic Integration, 2005
Classification boundary is in good agreement with the convergence of two horizons of the decollement. Classification result may indicate the initiation of plate boundary slip at the sole of the proto-thrust. Exaggerated geometry of the décollement Two horizons of the decollement connect immediately landward of the proto-thrust. When the plate boundary slip initiates, two horizons connect to one horizon in order to become less frictional condition. This geometry may indicate the plate boundary slip initiates at the sole of the proto-thrust. International Workshop on Core–Log–Seismic Integration, 2005
Conclusions • Attributes analysis • On the instantaneous phase, the weak events can be identified. • High pore pressure below the decollement is inferred from Q-value. • Classification result shows physical properties along the decollement change at the sole of the proto-thrust. • ODP data and the geometry of the decollement demonstrate that the classification result represents the initiation of plate boundary slip. International Workshop on Core–Log–Seismic Integration, 2005
Offset (~100 m) Crossline profile at 1 km seaward of the proto-thrust Seafloor Two-way time [s] Décollement Top of the oceanic crust International Workshop on Core–Log–Seismic Integration, 2005
学習の繰り返しにより、入力アトリビュートベクトルの特徴を反映.学習の繰り返しにより、入力アトリビュートベクトルの特徴を反映. 学習後のニューロン集合 SOM 三次元データの各サンプル毎にアトリビュートベクトルを設置. (エンベロープ,瞬間周波数,Q値,センブランス) 全サンプル数:40950000(個) =トレース数×1トレース毎のサンプル数 あるサンプルのアトリビュートベクトル (エンベロープ,瞬間周波数,瞬間Q値,センブランス) ②クラス分け ①学習(各ニューロンベクトルの更新) 乱数で初期化された ニューロン集合
掘削が2地点(検層:1地点)でしか行われていないため、掘削データだけからクラス分けの結果を評価するのは困難。そこで、以下の情報を用いて解釈を行う。掘削が2地点(検層:1地点)でしか行われていないため、掘削データだけからクラス分けの結果を評価するのは困難。そこで、以下の情報を用いて解釈を行う。 クラス分けの結果は検層データ(e.g.,間隙率)との相関から、物性との関係を評価されるのが一般的である。 1. ODPデータ 2.付加体の構造 3.デコルマの形状 しかし、 地質学会 2005.9.20