Analyzing ever growing datasets in PHENIX
210 likes | 230 Vues
This article discusses the analysis of ever-growing datasets in the PHENIX experiment, focusing on charged central arm tracks, EMC clusters, and muon candidates. The article also explores the challenges and strategies for handling and processing the large volume of data.

Analyzing ever growing datasets in PHENIX
E N D
Presentation Transcript
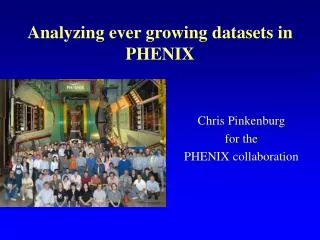
Analyzing ever growing datasets in PHENIX Chris Pinkenburg for the PHENIX collaboration
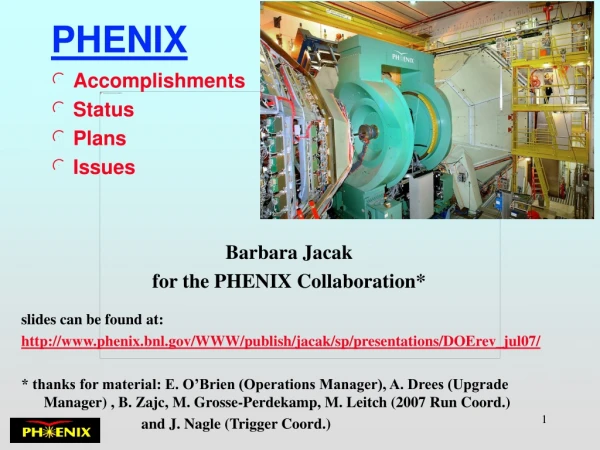
Stored in reconstructed output: Charged central arm tracks Emc clusters Muon candidates The PHENIX Detector h± h Many Subsystems for different Physics p0 High speed daq (>5kHz), selective Lvl1 triggers in pp, MinBias in AuAu Max rate ~800MB/s
Easy to remember Run to year matching @RHIC: Run2 ended in 2002 Run3 ended in 2003 … PHENIX Raw Data Volume PB sized raw data sets will be the norm for PHENIX Heavy ion runs produce more data than pp runs pp runs use triggers with high rejection factors, heavy ion mainly minbias
to do Reconstructed data (DST) size Reduction ~30% over raw data Total size: 700TB (1PB including Run10) Passing over all data sets the scale for necessary weekly I/O : 700TB/week=1.2GB/sec) average processing: about 500TB/week Copying data to local Disk and passing multiple times over it keeps network I/O within acceptable limits and makes jobs immune to network problems while processing
109 Events to do Reconstructed data (DST) size Size does not scale with number of Events: Run4: 1*109 Events Size: 70TB Run7: 4.2*109 Events Size: 200TB Run10: 10*109 Events Size: 300TB Run7 additional cuts on saved clusters/tracks applied Run10: full information but using Half floats and improved output structure
Number Of files Run4 came as a “surprise” showing that 1 raw data file ->1 DST is just not a good strategy Aggregating output files and increasing their size to now 9GB keeps the number of files at a manageable level Staging 100,000 files out of tape storage is a real challenge
PHENIX Output Files • Separate Output according to triggers • Data split according to content • Central arm tracks • emc clusters • muon candidates • detector specific info • Reading files in parallel possible - special synchronization makes sure we do not mix events • Recalibrators bring data “up to date”
From the Analysis Train… • The initial idea of an “analysis train” evolved from mid ‘04 to early ‘05 into the following plan • Reserve a set of the RCF farm (fastest nodes, largest disks) • Stage as much of the data set onto the nodes’ local disks; run all (previously tested on ~10% data sample: “the stripe”) analysis modules • Delete used data, stage remaining files, run, repeat • One cycle took ~ 3 weeks • Very difficult to organize, maintain data • Getting ~200k files from tape was very inefficient • Even using more machines with enough space to keep data disk resident was not feasible (machines down, disk crashes, forcing condor into submission,…) • Users unhappy with delays
… to the Analysis Taxi • Since ~ autumn ‘05 • Add all existing distributed disk space into dCache pools • Stage and pin files that are in use (once during setup) • Close dCache to general use, only reconstruction and taxi driver have access: performance when open to all users was disastrous - too many HPSS requests, frequent door failures, … • Users can “hop in” every Thursday, requirements are: code tests (valgrind), limits to memory and CPU time consumption, approval from WG for output disk space • Typical time to run over one large data set: 1-2 days
Rhic Computing Facility PHENIX portion • ~ 600 compute nodes • ~ 4600 condor slots • ~2PB distributed storage on compute nodes in chunks of 1.5TB-8TB managed by dCache backed by HPSS • BlueArc nfs server ~100 TB
User interfaces • Signup for nightly rebuild, gets retired after 3 months, button click re-signup • Signup for a pass, Code test required with valgrind • Module status page on the web • Taxi summary page on the web • Module can be removed from current pass The Basic Idea: User hands us a macro and tells us the dataset and the output directory The rest is our problem (job submission, removal of bad runs, error handling, rerunning failed jobs)
DB cvstags modules filesetlist Creates Module Output Directory Tree Dst type 1 log Dst type 2 Condor dir (1 per fileset) data … core Module Statistics Condor Job file run script File lists macros Job Submission submit perl script Dst type 2 All relevant information is kept in DB
DB Module Output Directory Tree Dst type 1 log Dst type 2 data … core Job Execution cvstags modules Filesetlist mod status run script Copies data from dCache to local disk and does md5 checksum Dst type 2 Runs independent root job for each module Module Statistics
50 QM 2009 40 30 20 10 Crunch time before conferences followed by low activity afterwards Weekly Taxi Usage We run between 20 and 30 modules/week Run10 data became available before Run10 ended!
1.5 GB/sec Observed peak rate >5GB/sec in and out Condor Usage Statistics Jobs are typically started Fridays and are done before the weekend is over (yes we got a few more cpus after this plot was made, it’s now 4600 condor slots) Jobs often get resubmitted during the week to pick up stragglers
Feb 2009: Use of fstat instead of fstat64 in filecatalog disabled detection of large files (>2GB) on local disk and forced direct read from dCache dCache Throughput Jan 2009: Start of statistics Between 1PB - 2PB/month, usage will increase when Run10 data becomes available
http://root.cern.ch/drupal/content/spin-little-disk-spin The number of cores keeps increasing and we will reach a limit when we won’t be able to satisfy the required I/O to utilize all of them One solution is to trade off cpu versus I/O by calculating variables instead of storing them (with Run10 we redo a major part of our emc clustering during readback) If precision is not important, using half precision floats is a space saving alternative Local disk I/O TTrees are optimized for efficient reading of subsets of the data, lots of head movement when reading multiple baskets When always reading complete events moving to a generic format would likely improve disk I/O and reduce filesize by removing the TFile overhead.
Train: Issues Disks crash, tapes break – reproducing old data is an ongoing task. Can we create files which have identical content compared to a production which was run 6 years ago? If not, how much of a difference is acceptable? It is easy to overwhelm the output disks (which are always full, the run script won’t start a job if its output filesystem has <200GB space) Live and learn (and improve) a farm is an error multiplier
Summary • Since 2005 this tool enables a weekly pass over any PHENIX data set (since Run3) • We push 1PB to 2PB per month through the system • Analysis code is tagged, results are reproducible • Automatic rerunning of failed jobs allows for 100% efficiency • Given ever growing local disks, we have enough headroom for years to come • Local I/O will become an issue at some point


