Download
1 / 44
440 likes | 556 Vues
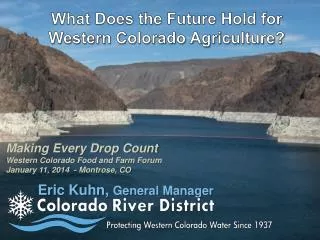
What Does the Future Hold for Western Colorado Agriculture? . Making Every Drop Count Western Colorado Food and Farm Forum January 11, 2014 - Montrose, CO . Eric Kuhn, General Manager. Water = Conflicts . 85 % of the people. 80 % of the water.

E N D
What Does the Future Hold for Western Colorado Agriculture? Making Every Drop Count Western Colorado Food and Farm Forum January 11, 2014 - Montrose, CO • Eric Kuhn, General Manager
Water = Conflicts 85% of thepeople 80% of the water
Transmountain diversions (to east)& downstream demands (to west) 450,000 to 600,000 acre-feet/year to Front Range 6 to 8,000,000 acre-feet/year to downstream states
Colorado River District Mission: To lead in the protection, conservation, use and development of the water resources of the Colorado River basin for the welfare of the District, and to safeguard for Colorado all waters of the Colorado River to which the state is entitled.
Minding the source for over 75 years:Colorado River Water Conservation District 1937 state statute 15 counties 28% of Colorado board director from each county mill levy & water activity enterprise
Colorado River District
How Does the Colorado River Measure up? all data in acre-feet/year
90%of the water 90%of the people
Colorado River Compact of 1922 Colorado, like all Upper Division states, shares obligations to the Lower Division III (d) the Upper Division shall “not cause the flow of the river at Lee Ferry to be depleted below an aggregate of 75,000,000 acre-feet for any ten consecutive years.” III (c) regarding Mexico…the Upper Division must “deliver at Lee Ferry water to supply one-half of the deficiency so recognized in addition to that provided in paragraph (d).”
Law of the River Allocations • 7.5 MAF to Upper Basin(%’s)1 • 7.5 MAF to Lower Basin (4.4 CA; 2.8 AZ; 0.3 NV)2 • 1.0 MAF additional to Lower Basin3 (i.e., tributary development) • 1.5 MAF to Mexico4______________________ 17.5 MAF Total Allocated ‘on paper’ 1 1922 Colorado River Compact, 1948 Upper Colorado River Compact 2 Colorado River Compact, Boulder Canyon Project Act, 1964 AZ v. CA 3 1922 Colorado River Compact 4 Treaty of 1944
We have NO “Delivery Obligation” The Upper Basin does not have a delivery obligation to the Lower Basin Important distinction: The States of the Upper Division are required to limit their post-compact developmentof water so that their actions do not cause the flow at Lee Ferry to drop below the 10-year running average of 75 Million Acre-Feet
Important Implications Article VIII of the 1922 Compact: “...present perfected rights to the beneficial use of waters of the Colorado River System are unimpaired by this compact.” Article IV(c) of the 1948 Compact: excludes water rights perfected prior to Nov. 24, 1922 from curtailment NOTE: The 1964 Arizona v. California Supreme Court decree includes a definition of “present perfected rights” that may apply.
Colorado River Basin Today • Seven basin states • Almost 300,000 square miles • 35 million people and growing • Up to 5.5 million irrigated acres • 15 million acre-feet of supply • 10 autonomous / sovereign Tribes • 2 countries
Colorado River Basin Tomorrow • Seven basin states • Almost 300,000 square miles • 3580 million people (↑ of ~90%) • 5.54.6 million irrigated acres • (↓ of ~15%) • 15 13.6 million acre-feet of supply • (↓ of 9-10%) • 10 autonomous / sovereign Tribes
Water Supply vs. Water Use (Annual Average) Estimates based upon CO River above Imperial dam
Water Supply vs. Water Use (10-year Running Average) Estimates based upon CO River above Imperial dam
Observed Water Supply Conditions Warming trend in Upper and Lower Basins since 1970s - consistent with observed North American and global trends Decreases in springtime snowpack - losses of snow water equivalent largest at low elevations suggesting a temperature-related effect Natural inter-annual variability in streamflow tends to be more dominant than observed trends Recent deficit(difference between the 2-yr running average flow and the long-term mean annual flow) since 2000 is more severe than any other deficit in the observed period (9 yrs. and 28 maf) Paleo reconstruction (762–2005) contains deficits that are longer in duration and larger (16 yrs. and as much as 35 maf). Deficits of greater severity than the recent deficit are possible (and possibly likely).
Projected Water Supply Conditions Warming is projected to increase across the Basin - largest changes in spring and summer; and in the Upper more than the Lower Basin Drying trends projected inregional & temporal - some precipitation ↑in higher elevations and northern basins - dryer springs and summers - some Lower Basin areas may have slight ↑in precipitation due to monsoonal influence in - Upper Basin precipitation may ↑ in fall & winter
Projected Water Supply Conditions (con’t) More precipitation falls as rain rather than snow Warmer temperatures cause an earlier melt Runoff (both direct and baseflow) is spatially diverse, but is generally projected to decrease,except in the northern Rockies
Comparison of Flow Scenarios 20 year mean 1988-2007* 13.2 MAF/year 25 year mean 1988-2013* 13.1 MAF/year Basin Study Climate Change 13.6 MAF/year 60-year mean 1953-2012* 13.9 MAF/year QUESTION: Which flow Scenario should we use for planning purposes? *Source: UCRC Annual Reports (2012 estimate) for Natural Flows at Lee Ferry, AZ
Current Use Estimates MAF/ year Upper Basin uses incl. reservoir evap. 4.0 - 4.5 Lower Basin mainsteam uses 7.5 - 7.5 Lower Basin reservoir evap. 1.0 - 1.5 Lower Basin tributaries 2.0 - 2.5 Total Lower Basin 10.5 - 11.5 Subtotal 14.5 - 16.0 Add Mexico 1.5 1.5 TOTAL 16.0 - 17.5 MAF
Projected Future Colorado River Basin Water Supply and Demand • By 2060 ave. supply-demand imbalances are approx. 3.2 MAF • Imbalances have occurred in the past and deliveries have been met due to reservoir storage
Colorado River Use Historical Consumptive Use
Water Demand Quantification Results (by water use sector)
Why Do We Care: • Solutions to these ‘imbalances’ can and will directly affect the Upper Colorado River Basin (& CRD) • Mitigation actions (increased development) can increase risk to historical (and future) users Ergo: others’ reward is our potential risk
Colorado River Storage Project Units (CRSP) Fontenell 3.7MAF capacity Currently: 75% full Flaming Gorge 3.7MAF active capacity 76% full fill fill CRSP Acts of 1956 and 1968 authorized construction of facilities for long-term regulation and development of Colorado River water resources Aspinall Unit: Blue Mesa, Morrow Point & Crystal Res. fill fill Blue Mesa 0.84MAF active capacity 46% full fill Navajo 1.7 MAF active capacity 57% full fill Source: USBR Upper Colorado Region storage levels as of 1/06/14 Lake Powell 26 MAF active capacity42%full
Southwest’s Dwindling Water SupplyLake Mead below 1,000’ above sea level affects millions Graph: USBR
Indicators of Vulnerability Vulnerability – performance below desired level • Indicators - “Lee Ferry Deficit” (aka Compact curtailment) if flows into Lake Powell are less than 75 MAF over 10 years then • Vulnerable Condition = Potential Curtailment
Mitigation Actions • Utilize different strategic actions • No Action: • Status Quo • Action Alternatives: • Decrease uses (demand mgmt. approach) in Upper and Lower Basins • Re-operate Upper Basin reservoirs
Lake Powell - Demand Mgmt & Reservoir Re-Operation (single trace 2000-2007; 1988-1999) Demand MgmtPLUSFG Re-Op: Powell PETrace 12 (2000-2007;1988-1999)
Lake Mead - Demand Mgmt & Reservoir Re-Operation (single trace 2000-2007; 1988-1999) Demand MgmtPLUSFG Re-Op: Powell PETrace 12 (2000-2007;1988-1999)
What is a Water Bank? Conservation with transfer mechanism Irrigators paid to reduce consumptive uses (e.g., deficit irrigation, rotational fallowing) Savings “banked” in a reservoir Two Basic Water Bank Strategies 1. to avoid a curtailment 2. to survive a curtailment
Many, Many Questions • Economics – are there sufficient willing buyers and sellers? • How are secondary economic & environmental impacts addressed? • How do we address the water rights implications? • Colorado shares the Lee Ferry obligations with three other states
West Slope Message • Long term, Basin math does not add up • Increase in demand vs. potential long term decrease in supplies • Climate change will decrease runoff (even though precipitation may increase, more ET) • Compact curtailment is punitive to historical users • Risk of curtailment requires careful development of remaining entitlement
Messages Ignored at Our Peril • The future risk of a curtailment is real and will continue to increase • The future is very uncertain – compact obligations, demands and hydrology • New development will increase the curtailment risk to existing uses • Without planning and foresight, the West Slope’s agricultural industries at risk
Policy Questions / Implications • Do new, broader market –based solutions represent our future? (i.e., conservation with transfers between sectors? Between states? Between basins?) • Can the Law of the River be enhanced to enable new conservation transfers mechanisms and still survive? • How do we mitigate risks of future development on existing uses / economies in the future? Risk Management through: Upper Basin Water Bank? New classes of water rights? Different administration schema? All parties will need to be engaged, informed, creative and flexible as we travel this path.
Augmentation • Cloud seeding (aka weather modification) • Non-native plant eradication / management • Dust management / mitigation • Smaller scale desalinization (coastal cities & brackish groundwater) • Larger efforts on water re-use / recycling • Imports from other basins (Mississippi & Snake) • Large scale desalinization
Uncertain Future: “Past performance does not guarantee future results”
Uncertain Times Require Certain Actions www.ColoradoRiverDistrict.org