Download
1 / 43
430 likes | 576 Vues
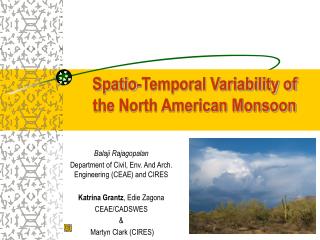
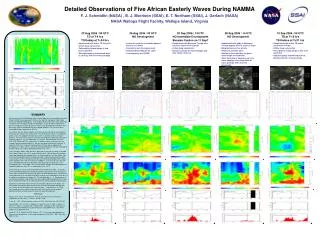
Impact of Tropical Easterly Waves during the North American Monsoon (NAM) using a Mesoscale Model. Jennifer L. Adams CIMMS/University of Oklahoma Dr. David Stensrud NOAA/National Severe Storms Laboratory October 27, 2005. What is the NAM?.

E N D
Impact of Tropical Easterly Waves during the North American Monsoon (NAM) using a Mesoscale Model Jennifer L. Adams CIMMS/University of Oklahoma Dr. David Stensrud NOAA/National Severe Storms Laboratory October 27, 2005
What is the NAM? • Distinct shift in mid-level winds accompanied by an increase in rainfall • Occurs over NW Mexico and SW United States • Onset usually in July and decays in September • Great deal of variability
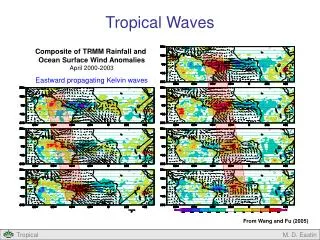
NAM Moisture Source • Moisture source current consensus • low-level moisture Gulf of California (GoC) • mid-level moisture Gulf of Mexico (GoM) • Transport of low-level moisture by gulf surges (one way) • Induced by passage of tropical easterly waves (TEWs) over GoC and/or outflow boundaries/gust fronts
Gulf surges Hales (1972) and Brenner (1974) • Cooler temps, increased dewpoints, pressure rise, southerly wind • Increase in convection • Shallow vertical extent • Loss of definition upon entering desert SW Adams and Comrie (1997)
Motivation • NAM predictability very low • TEWs influential to strength of NAM • Inverse relationship between NAM and U.S. central plains rainfall
Goals • Explore impact of TEWs on the NAM • gulf surges • NAM region rainfall • Control run of MM5 compared to simulation where TEWs are removed
Model Description • Pennsylvania State University/National Center for Atmospheric Research Mesoscale Model (MM5) • Model domain (350x180x23) at 25 km grid spacing Puerto Penasco
MM5 Parameterization Schemes • Kain-Fritsch convective scheme (Kain and Fritsch 1990) • MRF PBL scheme (Hong and Pan 1996) • Simple water and ice microphysics (Dudhia 1989) • Global terrain dataset – 10 minute resolution (25 USGS land use categories) • Rapid Radiative Transfer Model for radiation • 5-layer soil model (Dudhia 1996) • Model initialization: NCEP/NCAR reanalysis data • supply boundary conditions every 6-h • GoC SSTs set to constant 29.0ºC
Methodology • Four one-month periods • July 1990, July 1992, August 1988, August 1986 • ECMWF reanalysis data and CPC precipitation analysis • Varying number of TEWs and rainfall amounts
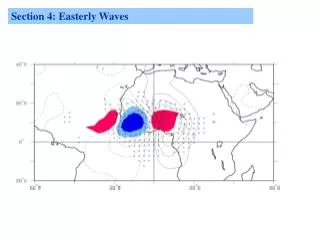
ECMWF Hövmoller Diagrams (850 mb) July 1990 July 1992 August 1986 August 1988
Methodology • Harmonic analysis to remove TEWs from boundary conditions • Reed et al. (1977) – TEWs average wavelength 2500 km, propagation speed of 8 m/s, and average period of 3.5 days • TEWs with periods of approx. 3.5-7.5 days identified – amplitudes replaced with value of zero south of 30ºN • T, q, u, v, ght, and slp
Harmonic Amplitudes (~40˚W) August 1988 Harmonic E Harmonic E TEW No-TEW
MM5 Hövmoller Diagrams (700 mb) TEW No TEW
Results • 18 surges over 4 months examined • 17 induced by TEW/tropical storm • Varying degrees of strength and frequency
Surge Criteria • Used time-series data at Puerto Penasco, Mexico as a “first pass” to ID surge events • Surges occur when: • winds shift to southerly • maximum daily dewpoint exceeding 65ºF for at least 2 days • peak wind speeds greater than 5 m/s • decrease in daily max temp of greater than 5ºF from the previous day
August 1986 Results • 6 surges in the control run • all show up in the time-series data at Puerto Penasco • 5 induced by TEWs and 1 initiated by a tropical storm (Howard?) • 2 TEWs possibly contained in the model initial conditions
TEW passage (18Z Aug 26) No TEW TEW
Pre-surge (18Z Aug 26) TEW No TEW
Surge onset (06Z Aug 27) TEW No TEW
Surge (12Z Aug 28) TEW No TEW
Post-surge (12Z Aug 29) TEW No TEW
Surge summary • TEW passage 12 hours prior to surge onset • Entire GoC shifts to southerly winds • 10 of 18 surges (most common) • Surge virtually absent from no-TEW simulation
TEWs and NAM rainfall • Absence of TEWs has impact on precipitation amounts over the NAM region • Many areas receive more rainfall when TEWs are present • Influences overall extent of NAM precipitation
Central Plains Rainfall Differences (TEW-no TEW) August 1988
Rainfall Differences (00Z Aug 17-06Z Aug 23) August 1988
Rainfall Differences -- 12Z Aug 19 - 00Z Aug 25 August 1986
Mid-latitude forcing -- 12Z Aug 20, 1986 TEW No TEW
Adding TEWs • July 1992 --> weak monsoon season July 1990 --> strong monsoon season • Removed waves from July 1992 boundary conditions • Inserted July 1990 TEWs into July 1992 boundary conditions
MM5 Hövmoller Diagrams Hybrid July 1992
Surge (00Z July 20) Hybrid July 1992
Conclusions • Harmonic analysis successfully removes TEWs from the model boundary conditions • MM5 reproduces surges over the GoC • full gulf, partial gulf, and SMO • NAM shows great deal of interannual variability • Surges impacted by absence of TEWs
Conclusions • Reduction of surge events in the no-TEW run reduced rainfall amounts over the NAM region • Absence of TEWs increases precipitation over the central United States • CAPE • mid-latitude forcing • Adding waves enhances NAM • more distinct surge events • increase in rainfall over core monsoon region
Harmonic Analysis • Since the model data used to create the boundary conditions are equally spaced in time and contain no missing values, the model data can be represented exactly as a series of n points in time by summing a series of n/2 harmonic functions….