Frequency: Nominal Variable Practice Problem
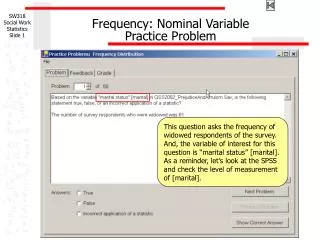
Frequency: Nominal Variable Practice Problem. This question asks the frequency of widowed respondents of the survey. And, the variable of interest for this question is “marital status” [marital]. As a reminder, let’s look at the SPSS and check the level of measurement of [marital].

Frequency: Nominal Variable Practice Problem
E N D
Presentation Transcript
Frequency: Nominal VariablePractice Problem This question asks the frequency of widowed respondents of the survey. And, the variable of interest for this question is “marital status” [marital]. As a reminder, let’s look at the SPSS and check the level of measurement of [marital].
Frequency: Nominal Variables-Measurement Level Variable [marital] is a nominal variable b/c there is no order between categories. In other words, even if we change the numbering scheme for the value label, it would not make any difference in the meaning. Thus, “marital status” [marital] is a nominal variable. Now, let’s find how to get frequency in SPSS.
Frequency: Nominal VariableFrequency in SPSS (1) In SPSS, you can obtain a frequency information of variables of interest using “Frequencies” function. Recalling the new convention I introduced in the last class, it can be implemented by clicking: Analyze > Descriptive Statistics > Frequencies In other words, first, click on Analyze in the menu bar of SPSS, then find and click on Descriptive Statistics on a pop-down submenu. Again, find and click on Frequencies on another pop-down submenu. Then, you will see a window shown in the next slide.
Frequency: Nominal VariablesFrequency in SPSS (2) First, find the variable of interest (i.e., [marital]) in the left-hand side box. Use scroll bar on the right to find the variable. You can select the variable by clicking the variable. Also, you can select more than one variable by clicking variables while you press and hold Control key on your keyboard (Ctrl).
Frequency: Nominal Variables Frequency in SPSS (3) Second, click on a small triangle between the boxes. It will move the selected variable(s) to the right-hand side box under “Variable(s): “.
Frequency: Nominal Variables Frequency in SPSS (4) Third, click on OK to see your output. Be sure the “Display frequency tables” checkbox is checked.
Frequency: Nominal Variables SPSS output window (1) SPSS will produce two tables in a separate window: a Statistics table and a frequency table. In the Statistics table, SPSS presents number of valid and missing responses to the marital status question. There are a total of 668 valid responses and no missing.
Frequency: Nominal Variables SPSS output window (2) The first column in the frequency table provides a complete list of categories of the variable and the second is for the corresponding frequencies. Recall that we are interested in the frequency of respondents who were widowed. The SPSS output shows that it is 61.
Frequency: Nominal VariableAnswer to Practice Problem Thus, the correct answer for this question is “True”.
Proportion: Nominal VariablePractice Problem This question asks about “proportion” of survey respondents who were never married. The variable of interest is again “marital status” [marital].
Proportion: Nominal VariableSPSS output (1) SPSS output does not provide proportion information directly. However, you can calculate the proportion using “Valid Percent” information on the third column in the frequency table. (Recall that Percent(%)=Proportion*100) The SPSS output shows that the proportion of “never married” respondents in the survey is 0.260 or 26%. Recall that the first column in the frequency table provides a complete list of categories of the variable.
Proportion: Nominal VariableSPSS output (2) • From this output, you can summarize your findings in several different ways. For example: • The probability of selecting “never married” respondents in our survey was 0.260 • The rate of survey respondents who were “never married” in 2002 (survey year) was 260 per 1,000. • Survey respondents were about three times more likely to have been married than to have been divorced.
Frequency: Ordinal Variables In this problem, the variable of our interest is “agreement with the statement that ethnic minority groups in the US are very different from one another” [ethdiff]. Let’s check the level of measurement of this variable, [ethdiff].
Frequency: Ordinal VariablesFrequency in SPSS (1) Find the variable, [ethdiff], using scroll bar and click on the gray square to see the value labels. Now, you can see that respondents with larger number more strongly agree with the statement “ethnic minority groups in the US are very different from one another” but the differences between the numbers is not definite. Thus, [ethdiff] is an ordinal variable.
Frequency: Ordinal VariableFrequency in SPSS (2) Again, you can obtain a frequency information of variables of interest using “Frequencies” function in SPSS. Recall that frequency for a variable can be obtained by clicking: Analyze > Descriptive Statistics > Frequencies In other words, first, click on Analyze in the menu bar of SPSS, then find and click on Descriptive Statistics on a pop-down submenu. Again, find and click on Frequencies on another pop-down submenu.
Frequency: Ordinal VariablesFrequency in SPSS (3) Find and select the variable, [ethdiff], in the list and move to the Variable box on the left. Click on OK button to see a SPSS output window.
Frequency: Ordinal VariablesSPSS output window Frequency output table shows that there were 49 survey respondents who “strongly agreed” to the statement that “ethnic minority groups in the US are very different from one another”. In other words, the proportion of those who strongly agreed to the statement was 0.075 or 7.5%. It can also be stated that the probability of selecting a survey respondents who strongly agreed to the statement from the cases in the data was 0.075.
Frequency: Interval Variable “Age” [age] was treated as an interval level variable in this survey. When we use interval level variable, it is sometimes useful to recode the original variable into another variable that is easier to interpret. Following slides explain how to recode these variables.
Use Recode in SPSS (1) You can recode a variable into another variable using Transform > Recode > Into Different Variables . (>Into Same Variables basically do the same job but overwrite the original variable with the recoded one.) Now, you will see a new window as shown in the next slide.
Use Recode in SPSS (2) First, find and select the variable you want to recode by clicking on the variable label. Second, click on the side-faced triangle between the boxes.
Use Recode in SPSS (3) First, type in a new variable name [rc_age] and label “recoded age variable” in text boxes in the Output Variable section and click on Change button. Second, click on Old and New Values button to assign recoded numbers for the new variable.
Use Recode in SPSS (4) First, in the Old Value section of the new window, click on Range radio button and then type in the values you want to recode. Second, on the right hand side, make sure you clicked the Value radio button and type in a new value that you want to assign to the value range you set in the Old Value section. Now, click on Add button.
Use Recode in SPSS (5) Once you finish assigning the new values to the corresponding old values, click on Continue and then OK in the next window.
Create Value Labels in SPSS (1) Now you will see a new variable “recoded age variable” [rc_age] in the Variable View window. However, it is always a good idea to assign a value labels to the recoded variables because you might not remember exactly what these numbers meant originally, let’s say, a year later.
Create Value Labels in SPSS (2) Recall how you examine value labels in the last class. Click on Values cell for the recoded variable [rc_age] and then a gray square button.
Create Value Labels in SPSS (3) In the Value Labels window, type in a number for the new variable in the Value textbox and description of the value in the Value Label textbox. Then, click on Add button. Once you finish it for every value in the new variable, click on OK button.
Frequency: Interval VariableFrequency in SPSS (1) Scroll down to find and select the recoded age variable [rc_age]. Click on the triangle and, then, OK button.
Frequency: Interval VariableFrequency in SPSS (2) Recalling we are interested in the number of survey respondents who were 50-59 years of age, it is 105.
Frequency: Interval VariableFrequency in SPSS (3) There are a few points that need to be mentioned. First, notice that numbers for Percent (19.2) and Valid Percent (19.3) of “age 40-49” are different. It is because of 4 missing cases as shown at the bottom of the table. It should be noted that the Valid Percent was calculated with the valid survey responses (i.e., 128/664=0.193) as denominator while the Percent was calculated with total survey responses (i.e., 128/668=0.192).
Frequency: Interval VariableFrequency in SPSS (4) Second, Cumulative Percent provides an additional information especially when the variable of interest is ordinal or interval. For example, the cumulative percentage of survey respondents who were 10 to 49 years of age was 60.1%. In other words, the proportion of survey respondents who were 10-49 years of age was 0.601.