Download
1 / 42
420 likes | 512 Vues
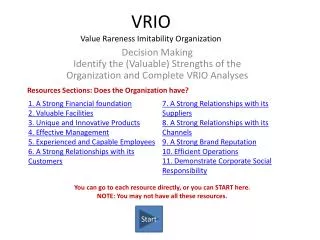
Evaluating sustainability using the Green Globes system with a focus on energy, emissions, water, and indoor environment. The tool facilitates building assessments and provides recommendations for a sustainable campus. Utilize the BEAT tool for detailed energy analysis and cost-effective reduction strategies. Assess different building types with specific questions. Monitor energy performance and establish reduction goals for a greener future.

E N D
RATING THE SUSTAINABILITY OF CAMPUS FACILITIES MANAGEMENT: A FOUNDATION FOR ACTION DarrylK. Boyce, P Eng., Assistant Vice-President (Facilities Management and Planning) Carleton University
GREEN GLOBES SYSTEM • Energy and Environmental Assessment Tool • Facilitates Assessment of Buildings by Owners • Question Based tool Rating: • Energy • Water • Resources • Emissions • Effluents and hazardous materials • Indoor environment • Environmental Management
Green Globes Assessment & recommendations GG re-assessment GG re-assessment A holistic approach— path to sustainability Gaps
Facilities Department Campus Portfolio Assessment Different building types (e.g. multi-residential, administration, sports, light industrial, labs etc.) One set of questions for the campus Different set of questions for each building type • Building A (residence) • Physical attributes of the base building • Performance metrics • Building B (residence) • Physical attributes of the base building • Performance metrics • Building C (sports facility) • Physical attributes of the base building • Performance metrics • Building D (classrooms) • Physical attributes of the base building • Performance metrics • Building D (classrooms) • Physical attributes of the base building • Performance metrics
Identify the different types of buildings Carleton University Building Portfolio Office and Academic 179,830 m2 Labs 46,981 m2 Residences 68,046 m2 Sport Facilities 31,472 m2 TOTAL 326,329 m2
Green Globes individual building questionnaire • EMISSIONS & EFFLUENTS • Boiler emissions • Refrigerants • Protection of floor drains from spills • Hazardous materials on site (incl. asbestos, PCBs) • INDOOR ENVIRONMENT • IAQ features (ventilation, filtration, humidification) • Cooling tower features • Exhaust of special use areas • Parking and receiving areas • Control of Indoor Pollutants • Mould • Lighting quality • Acoustic quality ENERGY • Lighting features • HVAC features • Hot water system • Building controls (BAS) • Sub-metering • Other energy efficiency features (heat recovery, variable speed drives, energy efficient motors etc.) • Renewable energy systems • Building Envelope features and condition WATER • Water efficient fixtures WASTE • Waste storage areas
Energy Calculator – The BEAT • Complements Green Globes by providing more in-depth analysis of a building’s energy use, with easy-to-understand outputs • Serves to establish realistic, cost effective reduction goals and targets by targeting possible problem areas. (for example, a building that appears to be heating and cooling at the same time) • Provides on-going monitoring, useful for pre and post retrofit performance evaluation • Provides a solid engineering foundation for Carbon Footprint calculations and development of potential carbon reduction opportunities. • Fast and easy to do. Requires only data from energy bills, and completing approximately 25 “yes no” type questions regarding, lighting, control systems, HVAC equipment, heating and cooling equipment and plug load.
Annual energy performance Potential costs, savings, ROI Key energy saving measures for consideration BEAT Outputs: One-Page Executive Summary
BEAT outputs – electricity consumption trend for the building, weather correlated for cooling
BEAT outputs – steam consumption trend for the building, weather correlated for heating
BEAT outputs – natural gas consumption trend for the building, weather correlated for heating
End use e.g. Lighting Energy saving measures e.g. Complete upgrade to high efficiency lamps. Upgrade/replace lighting controls Payback (years) e.g. 2.9 BEAT outputs Cost to implement e.g. $31K Potential savings e.g. $10,867
BEAT: a carbon reporting tool Current greenhouse gas emissions Target greenhouse gas emissions Potential greenhouse gas reduction
BEAT outputs Electricity Consumption Trend 2007-2010 Overall electricity use in first year since Green Globes assessment (Base Year 2008) decreased despite addition of 1 new building on campus.
BEAT outputs Electricity Demand Trend 2007-2010 Overall electricity demand in first year since Green Globes assessment increased by an average 135 kW per month since addition of 1 new building – yet overall electricity consumption decreased in 2009-2010
Green Globes Levels • 1 = 15 - 34% • 2 = 35 - 54% • 3 = 55 - 69% • 4 = 70 - 84% • 5 = 85 +%
Level 1 Energy Audit • Facilitates consideration of rough estimates of energy saving measures (walk-through analysis) • Facilitates the analysis of energy bills • Identifies systems that may require further analysis
Reporting energy efficiency features for the portfolio Sub metering Sub-metering and proper monitoring of energy consumption improves energy awareness and leads to energy savings
The BEAT - Building Energy Allocation Tool – helps to break out energy and water consumption by major end users
Ongoing tracking of Greenhouse Gas Emissions, with clearly defined targets based on identified energy retrofit opportunities by building
Green Globes campus management questionnaire Resource use (paper and consumer items, furniture, building materials) Recycling policy and program Waste audits Waste targets and monitoring C&D waste management policy Site remediation Site enhancement Landscaping (irrigation, xeriscaping, naturalized) Storm water management Management of ozone-depleting substances Management of storage tanks, asbestos, PCBs etc Health and safety, WHMIS Pesticide management HVAC maintenance procedures Policies and procedures to control pollutants at source (cleaning contracts, smoking, construction IAQ, IAQ audits IAQ monitoring Lighting remote sensing and control Relamping and cleaning • Environmental policy • Environmental purchasing • Communications with occupants • Emergency management • Energy consumption • Energy management • CO2 emissions • Green energy • Energy policy • Energy audits • Energy targets and monitoring • Energy training • Energy budget • Energy sub-metering • HVAC maintenance and commissioning • Remote sensing and controls • Building condition reports • Transportation • Water consumption • Water policy • Water audits • Water targets and monitoring
Campus wide operation and management - 2009 Two areas – Waste Management and Water Management – were targeted for improvements – concentrating on no cost/low cost opportunities
Reporting water efficient features for the portfolio Water audit focused on flow measurement
Detailed audit of each building on the campus identified that in majority of cases actual flow rates through the fixtures is higher than the marked flow rates With dual flush toilets (6.0 lpf and 4.3 lpf) and low flow aerators on all sinks (1.9 lpm ) 70% savings are achievable Water
Waste Audit Current diversion 49% Target 2015 60% Detailed audit for each building on the campus identified substantial opportunity for diverting waste and achieving significant cost savings
Campus wide operation and management - 2010 Waste Management and Water Management both showed improvements versus the 2008 Base Year – with water management improving from 29% to 69%.
Conduct in-depth energy audits on identified buildings Set energy targets for decreased energy use Implement cost-effective improvement measures ($$$) where feasible Develop an energy policy for each building with established targets and recommended action steps Energy
Implement cost-effective improvement measures ($$$) where feasible Develop a water policy for each building with established targets and recommended action steps Water
7 buildings out of 41 produce 80% of the waste Produce a waste policy for each building - with established targets and recommended action steps. Waste
The university is acting on the Green Globes Campus Assessment recommendations – with measurable improvements in performance – and reduced utility costs. Suspect sub meter readings for all buildings identified and targeted, allowing for more accurate assessment, implementation and monitoring of energy reduction strategies. By doing more thorough energy monitoring, and detailed water and waste audits, the poorer performing buildings are being targeted – with measurable improvements in Year 1. University staff and students adding to momentum of Green Globes initial assessment and overall campus sustainability efforts. Lessons Learned
Integration with the FPI • The program will be operated as a separate module but accessed through the FPI survey • The module will be open year round with a 4 week lock down for data transfer
Sustainability Benchmarking • Data comparison in the following areas: • Average energy performance by building type • Age and size of buildings by building type • % of energy and sustainability features by building type
Sustainability Benchmarking • % of sub metered buildings on Campus • Carbon emissions by building type • Water use performance by building type • Average Green Globes rating by building type