Download
1 / 8
80 likes | 185 Vues
Learn about Mean, Median, Mode, and Range as measures of central tendency and variation in data sets. Discover the purpose and application of each, along with practical examples. Understand when to use these measures effectively for data analysis.

E N D
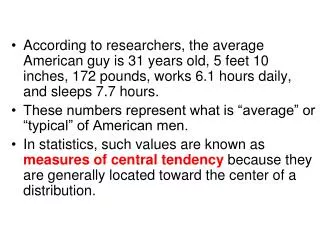
Measure of Central Tendency • A number used to describe the center of a set of data • Mean, Median, Mode
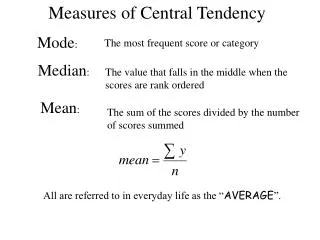
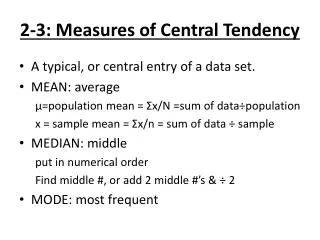
Mean • The sum of the data divided by the number of items in the set • “average” The average teacher is Mean • Ex: 1 cm, 1 cm, 5 cm, 2 cm, 2 cm, 4 cm, 2 cm, 5 cm
Mode • The number that occurs most often. • Mode = most often
Mode examples??? • No mode • One mode • Two modes
MedianHighway medians are in the middle. • After the data set has been ordered least to greatest, it is the middle number or the mean(average) of the two middle numbers • Ex: 15 yd, 7 yd, 20 yd, 17 yd, 11 yd, 20 yd
Range • Is a “measure of variation” • Difference between the least and greatest values
When to use what??? • Mean- when data has no outliers • Median- when data has outliers and there are no big gaps in the middle of the data • Mode- data has many identical numbers • Range- to describe the spread of data