Download
1 / 46
520 likes | 895 Vues
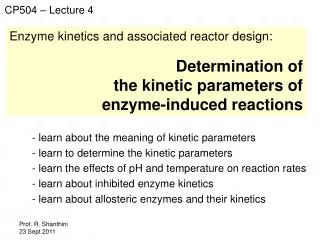
CP504 – Lecture 4. Enzyme kinetics and associated reactor design: Determination of the kinetic parameters of enzyme-induced reactions. learn about the meaning of kinetic parameters learn to determine the kinetic parameters learn the effects of pH and temperature on reaction rates

E N D
CP504 – Lecture 4 Enzyme kinetics and associated reactor design: Determination of the kinetic parameters of enzyme-induced reactions • learn about the meaning of kinetic parameters • learn to determine the kinetic parameters • learn the effects of pH and temperature on reaction rates • learn about inhibited enzyme kinetics • learn about allosteric enzymes and their kinetics
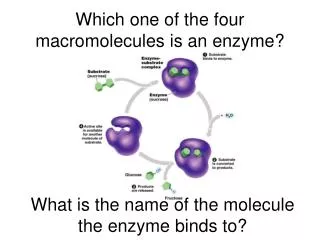
Simple Enzyme Kinetics (in summary) k1 k3 E + S ES E + P k2 which is equivalent to [E] P S S for substrate (reactant) E for enzyme ES for enzyme-substrate complex P for product
Simple Enzyme Kinetics (in summary) [E] P S rmaxCS = - rS rP = KM + CS wherermax = k3CE0and KM = f(rate constants) rmax is proportional to the initial concentration of the enzyme KM is a constant
rmaxCS = - rS KM + CS Simple Enzyme Kinetics (in summary) -rs Catalyzed reaction Catalyzed reaction rmax rmax uncatalyzed reaction 2 KM Cs
How to determine the kinetic parameters rmax and KM ? Carry out an enzyme catalysed experiment, and measure the substrate concentration (CS) with time. rmaxCS - rS = KM + CS From the data, we could calculate the substrate utilization rate (-rs) as follows:
How to determine the M-M kinetics rmax and KM ? Carry out an enzyme catalysed experiment, and measure the substrate concentration (CS) with time. rmaxCS - rS = KM + CS From the data, we could calculate the substrate utilization rate (-rs) as follows:
CS KM 1 CS + = - rS rmax rmax 1 KM 1 1 + = - rS rmax rmax CS - rS rmax - - rS KM = CS We could rearrange rmaxCS - rS = KM + CS to get the following 3 linear forms: (14) (15) (16)
CS - rS 1 rmax The Langmuir Plot CS KM 1 CS (14) + = - rS rmax rmax - KM CS
CS - rS 1 rmax The Langmuir Plot CS KM 1 CS (14) + = - rS rmax rmax • Determine rmax more accurately than the other plots. - KM CS
1 - rS KM rmax 1 CS The Lineweaver-Burk Plot 1 KM 1 1 (15) + = - rS rmax rmax CS 1 - KM
1 - rS KM rmax 1 CS The Lineweaver-Burk Plot 1 KM 1 1 (15) + = - rS rmax rmax CS • Gives good estimates of rmax, but not necessarily KM • - Data points at low substrate concentrations influence the slope and intercept more than data points at high Cs 1 - KM
KM -rS CS The Eadie-Hofstee Plot - rS rmax - - rS KM = (16) CS - rS rmax KM
KM -rS CS The Eadie-Hofstee Plot - rS rmax - - rS KM = (16) CS - rS • Can be subjected to large errors since both coordinates contain (-rS) • - Less bias on point at low Cs than with Lineweaver-Burk plot rmax KM
Data: Determine the M-M kinetic parameters for all the three methods discussed in the previous slides.
rmax = 1 / slope = 1 / 1.5866 = 0.63 mmol/l.min KM = rmax x intercept = 0.63 x 4.6417 = 2.93 mmol/l
rmax = 1 / intercept = 1 / 1.945 = 0.51 mmol/l.min KM = rmax x slope = 0.51 x 3.4575 = 1.78 mmol/l
rmax = intercept = 0.54 mmol/l.min KM = - slope = 1.89 mmol/l
The effects of pH and temperature on reaction rate Most enzymes function over a broad range of pHs and temperatures. However, they have an optimal pH and temperature for peak activity. In general, enzyme activities increase with increasing temperatures; however, as temperatures get higher, enzymes begin to denature. Most enzymes are also sensitive to pH. As with temperature, the optimal pH for an enzyme depends on the environment in which it normally functions. https://wikispaces.psu.edu/display/230/Enzyme+Kinetics+and+Catalysis
The effects of temperature on reaction rate Optimal for most human enzymes Optimal for some thermophillic bacterial enzymes Reaction rate Temperature (deg C) https://wikispaces.psu.edu/display/230/Enzyme+Kinetics+and+Catalysis
The effects of pH on reaction rate Optimal for trypsin (an intestinal enzyme) Optimal for pepsin (a stomach enzyme) Reaction rate pH https://wikispaces.psu.edu/display/230/Enzyme+Kinetics+and+Catalysis
Complex enzyme kinetics • learn about inhibited enzyme kinetics • learn about allosteric enzymes and their kinetics
Inhibited enzyme reactions Inhibitors are substances that slow down the rate of enzyme catalyzed reactions. There are two distinct types of inhibitors: - Irreversible inhibitors form a stable complex with enzymes and reduce enzyme activity (e.g. lead and cadmium) - Reversible inhibitors interact more loosely with enzymes and can be displaced.
Inhibited enzyme reactions Inhibitors are also classified as competitive and non-competitive inhibitors.
Competitive inhibition A competitive inhibitor has a chemical and structural similarity to the substrate. It competes with the substrate for the position at the active site of the enzyme. The rate of the reaction slows down because the active site is occupied by the competitive inhibitor, making the active site less accessible to the substrate. https://ibhumanbiochemistry.wikispaces.com/C.7.5
Competitive inhibition Competitive inhibitors (denoted by I) compete with substrate to occupy the active site of the enzyme. k1 k3 E + S ES E + P k2 k4 E + I EI k5 where rP = k3 CES (17) CE0 = CE + CES + CEI (18)
Competitive inhibition Assuming rapid equilibrium, we get k1 CE CS = k2 CES k2 CE CS KM = = (19) k1 CES k4 CE CI = k5 CEI k5 CE CI KI = = (20) k4 CEI
Competitive inhibition Combining (17) to (20), we get rmaxCS k3CE0CS (21) = rP = KM,app + CS KM (1 + CI / KI) + CS where rmax = k3CE0 (5) (22) KM (1 + CI / KI) KM,app = KM = k2 / k1 (6) KM,app > KM
1 - rS 1 CS Competitive inhibition The Lineweaver-Burk Plot CI > 0 CI = 0 (no inhibitor) 1 - KM, app 1 - KM 1 rmax
Competitive inhibition In the presence of a competitive inhibitor, the maximal rate of the reaction (rmax) is unchanged, but the Michaelis constant (KM) is increased.
Non-competitive inhibition Non-competitive inhibitor binds to the enzyme, but not on the active site. Ittherefore does not compete with the substrate. However, non-competitive inhibitor causes the enzyme’s active site to change shape and as a result, the substrate can no longer bind to it, decreasing the rate of the reaction. https://ibhumanbiochemistry.wikispaces.com/C.7.5
Non-competitive inhibition k1 k3 E + S ES E + P k2 k4 E + I EI k5 k6 EI + S EIS k7 k8 ES + I ESI k9
Non-competitive inhibition We could drive the rate equation (given on the next page) assuming the following: k2 k7 = KIM = KM = k1 k6 k5 k9 = KMI = KI = k4 k8
Non-competitive inhibition rmax,appCS (23) rP = KM + CS where rmax (24) rmax,app = (1 + CI / KI) rmax = k3CE0 (5) KM = k2 / k1 (6) rmax,app < rmax
1 - rS 1 CS Non-competitive inhibition The Lineweaver-Burk Plot CI > 0 1 rmax,app CI = 0 (no inhibitor) 1 - KM 1 rmax
Non-competitive inhibition In the presence of a non-competitive inhibitor, the maximal rate of the reaction (rmax) is lower but the Michaelis constant (KM) is unchanged.
Sigmoid/Hill kinetics A particular class of enzymes exhibit kinetic properties that cannot be studied using the Michaelis-Menten equation. The rate equation of these unique enzymes is characterized by Sigmoid/Hill kinetics as follows: rmaxCSn The Hill equation (25) rP = K+ CSn Hill constant Hill coefficient n = 1 gives Michaelis-Menten kinetics n > 1 gives positive cooperativity n < 1 gives negative cooperativity http://chemwiki.ucdavis.edu/Biological_Chemistry/Catalysts/Enzymatic_Kinetics/Sigmoid_Kinetics
Sigmoid/Hill kinetics Examples of the “S-shaped” sigmoidal/Hill curve, which is different from the hyberbolic curve of M-M kinetics. n = 6 n = 4 n = 2
Sigmoid kinetics For an alternative formulation of Hill equation, we could rewrite (25) in a linear form as follows: rP CSn θ = = rmax K+ CSn θ (26) ln = n ln(CS) – ln (K) 1 - θ http://chemwiki.ucdavis.edu/Biological_Chemistry/Catalysts/Enzymatic_Kinetics/Sigmoid_Kinetics
“Food for Thought” Problem 3.13 from Shuler & Kargi: The following substrate reaction rate (-rS) data were obtained from enzymatic oxidation of phenol by phenol oxidase at different phenol concentrations (CS). By plotting (-rS) versus (CS) curve, or otherwise, determine the type of inhibition described by the data provided?
Substrate inhibition Cover it next time
Uncompetitive inhibition Cover it next time
Allosteric enzyme Cover next time in relation to competitive inhibition http://chemwiki.ucdavis.edu/Biological_Chemistry/Catalysts/Enzymatic_Kinetics/Sigmoid_Kinetics