Download
1 / 71
710 likes | 846 Vues
Sudbury Toronto Montreal. 2003 State of the Community Survey Results Prepared for The Corporate Strategy and Policy Office of the CAO. Robert C. Sinclair , Ph.D. Paul A Seccaspina, Ph.D. Vice President President.

E N D
Sudbury Toronto Montreal 2003 State of the Community Survey Results Prepared for The Corporate Strategy and Policy Office of the CAO Robert C. Sinclair, Ph.D. Paul A Seccaspina, Ph.D. Vice President President
Team Members • Oraclepoll Research: Paul Seccaspina Bob Sinclair • City of Greater Sudbury Carlos Salazar
CORPORATE PROFILE • We are a national research firm based in Sudbury with offices in Toronto and Montreal. • Our staff include 3 senior analysts, 8 support staff, and 40 research staff. • The company was founded in 1995 and has experienced consistent annual growth since then. • Our call centre is equipped with state of the art Voxco Computer Assisted Telephone Interview (CATI) software. • Our experience ranges from client satisfaction to program evaluation to advertising / product testing & tracking.
PARTIAL CLIENT LIST • BCE (Télébec, Sympatico, Lino, Northern Telephone, Northwestel, Nortel & Télébec Mobility) • CTV National Sales and Marketing • Domtar • Durham Regional Police • General Motors / Saturn Corporation • Inco Ltd. • Johnson & Johnson • Northwest Territories Power Corporation • OMERS • Sudbury Regional Hospital • Toronto Public Health • World Wildlife Fund
Paul A. Seccaspina, President • Honours B.A., 1986, Laurentian University • M.A, 1988, University of Western Ontario • Ph.D., 1997, University of Warwick • Lecturer, Department of Political Science, Laurentian University, 1988-1993 • Lecturer, Civic Education Project / Yale University, Moldova, 1993-1994 • After a career in banking, the securities industry and academia, Dr. Seccaspina founded Oraclepoll in 1995. • Since that time he has built a national client base that spans government, the private sector (including several Fortune 500 firms) and not for profit organizations. • He has built the company by offering a quality product and excellent service to the corporation’s clients. • He regularly deals with media inquires and has been cited in all major Canadian news outlets.
Robert C. Sinclair, Vice President • Honours B.A., 1981, University of Western Ontario • M.Sc., 1984, The Pennsylvania State University • Ph.D., 1988, The Pennsylvania State University • Professor, Department of Psychology, Central Michigan University, 1987-1991 • Professor, Department of Psychology, University of Alberta, 1991-2001 • Dr. Sinclair is listed among The 2000 Outstanding Scientists of the 21st Century. • He is listed among The 2000 Eminent Scientists of Today. • He has approximately 100 scientific publications / presentations / invited talks. • He was a member of the Social Sciences & Humanities Research Council of Canada Grant Adjudication Committee. • He has appeared on national and international television networks including CBS, ABC, CNN, BBC, CTV, CBC, and Global. • He has been interviewed by the New York Times, Washington Post, Los Angeles Times, National Post, Globe and Mail, and numerous other newspapers. • Dr. Sinclair has extensive experience consulting in the areas of Organizational Development, Organizational Culture, and Program Evaluation, both nationally • and internationally.
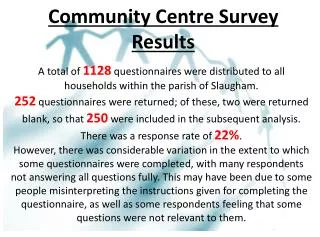
Methodology & Logistics • Random Sample Survey • 1200 residences • 100 businesses
Rationale for Survey Research • Informational Benefits • Importance of Public Opinion / Community Involvement • Internal Benchmarking • Development of Action Plan
Overview of Descriptive Data • Satisfaction levels among those residents who have had contact with the City are low as comments reveal citizen discontent over reaching the appropriate person and having their needs, issues and concerns dealt with. • Discontent among residents is most evident with respect to infrastructure including roads. • There remains an “in” and “out” divide as residents of the Greater Sudbury Area (GSA) are more likely to be concerned with, infrastructure as well as fire and policing issues than those of the City core.
Percent Agreement 2000 2001 2002 2003 The community provides quality post college education Na Na Na 73% The community provides quality post secondary university education Na Na Na 70% The community provides opportunities for healthy living Na 71% 68% 67% The community offers good cultural institutions Na 53% 48% 54% The community has a strong and viable arts and cultural community 44% 42% 43% 44% The community provides seniors in our areas with quality care 32% 40% 30% 35% The community provides quality health care services to residents 36% 34% 29% 35% Healthy Community
Percent Agreement 2000 2001 2002 2003 Rather than building new facilities or roads, the City should invest in maintaining and improving existing facilities and roads 78% 72% 78% 79% Where appropriate the direct users of City services should pay for the cost of providing those services 38% 41% 36% 37% The City should maintain current levels of service and increase taxes up to 5% 22% 37% 37% 32% The City should reduce service levels by whatever is needed in order to hold the line on taxes 33% 21% 25% 23% Budget Issues
Top 5 Issues in Terms of Importance • Fire Protection • Winter Road Maintenance • Maintenance of Main Roads • Ambulance Services • Police Services
Bottom 5 Issues in Terms of Satisfaction • Maintenance of Main Roads • Winter Road Maintenance • Economic Diversification • Providing Quality Land Development • Child Care Funding
Ward-Related Differences: Satisfaction & Importance Performance Indicators Mean scores were computed based on the ratings of the performance indicators falling into each organizational unit of the City of Greater Sudbury, for both satisfaction and importance ratings Reliability analyses were also conducted
Ward-Related Differences: Satisfaction & Importance Performance Indicators 7 (City Service) X 6 (Ward) mixed-model analyses of variance were conducted on the satisfaction and importance ratings based on the performance indicators Tests: • Are there significant differences among the city services? • Are there differences among the wards? • Are there City Service X Ward interactions? (i.e., are there different patterns of ratings of city services in the different wards?)
Conclusions & Recommendations • Ensure that the GSA does not feel disenfranchised • People are most satisfied with Emergency Services and Public Health • People are least satisfied with Public Works and Economic Development & Planning • Target Public Works and Economic Development & Planning • Target Gaps in Public Works, Police Services, Emergency Services, and Economic Development and Planning
Problems/Solutions Regarding Performance Indicators Halo Error • On performance indicators involving multiple measures/categories (e.g., Economic Development & Planning), responses on one measure color responses on other performance indicators within category – addressing individual measures could be misleading – use mean responses • The general public does not always perceive performance indicators as representing the appropriate organizational unit in the city; thus, responses on one organizational unit can color responses on another (e.g., providing affordable housing can color responses on the Social Services indicators) – increase public awareness regarding the functions of the organizational units – use multiple indicators that map appropriately onto the organizational units – use mean responses
Problems/Solutions Regarding Performance Indicators Single Indicators • Single indicators (e.g., Police Services, Public Health) are notoriously unreliable and lead to invalid inferences • Multiple indicators are needed in order to address each aspect of a particular organizational unit (e.g., measures of satisfaction with the various multifaceted aspects of Police Services would increase validity and provide more important information regarding the aspects of Police Services that need to be targeted [cf. On a scale from very poor to very good, please rate the level of Police Service that is currently provided]) – develop multiple indicators and use mean responses
Problems/Solutions Regarding Performance Indicators Need for Transactional Data • Satisfaction measures on performance indicators on which respondents have no experience are extremely problematic (e.g., asking people to evaluate satisfaction with libraries, when they have not used a library can distort the data associated with libraries) – move toward transaction-based (i.e., experience-based) surveys involving multiple indicators and mean responses • Conduct focus groups
Significant issues – Of respondents with an opinion 2000 2001 2002 2003 Jobs / Unemployment 15% Taxes (high) 25% Taxes (high) 21% Roads 14% Amalgamation / Municipal restructuring 11% Jobs / Unemployment 13% Economic diversification 14% Jobs / Unemployment 14% Economic diversification 11% Economic diversification 10% Business friendly environment 12% Taxes 12% Economy 8% Business friendly environment 8% Jobs / Unemployment 11% Economic diversification 12% Keeping youth here 8% Restructuring (process) 7% Service accessibility 10% By-laws 12% Taxes (high) 7% Service accessibility 5% By-laws 7% Population decline 5% Top of Mind Issues (Excluding responses of Don’t Know)
Percent Agreement 2000 2001 2002 2003 Rather than building new facilities or roads, the City should invest in maintaining and improving existing facilities and roads 64% 76% 69% 78% Where appropriate the direct users of City services should pay for the cost of providing those services 59% 48% 49% 47% The City should reduce service levels by whatever is needed in order to hold the line on taxes 28% 31% 26% 22% The City should maintain current levels of service and increase taxes up to 5% 16% 32% 28% 30% Budget Issues
Satisfaction withContact with a Municipal Staff Member • 58% contacted a municipal staff member • Only 54% rated the experience as positive (a 10% decline from 2002) • A lack of response/action and poor service were cited as areas for improvement
Top 5 Issues in Terms of Importance • Fire Protection • Maintenance of Main Roads • Winter Road Maintenance • Planning for the City’s Future • Ambulance Services
Bottom 5 Issues in Terms of Satisfaction • Maintenance of Main Roads • Developing Job Creation Initiatives • Child Care Funding • Economic Diversification • Winter Road Maintenance