Understanding and Graphing Linear Inequalities
This guide explores linear inequalities, providing a clear definition and different types. It covers graphing on number lines and coordinate planes, explaining key terms such as "less than," "greater than," and the differences between solid and dashed lines. Learn how to convert inequalities to slope-intercept form, graph them accurately, and test points to see if they satisfy the inequalities. With practical examples and exercises, this resource equips you to understand and visualize inequalities effectively.


Understanding and Graphing Linear Inequalities
E N D
Presentation Transcript
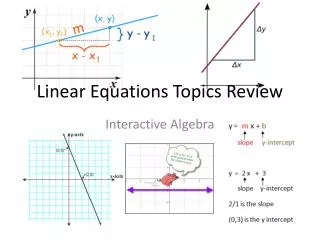
Review topics Inequalities
Warm Up Graph each inequality. 1. x > –5 2.y ≤ 0 3. Write –6x + 2y = –4 in slope-intercept form, and graph. y = 3x – 2
What is a good definition for Inequality? Inequalities and their Graphs An inequality is a statement that two expressions are not equal
Two types • Graphing on a number line: • Graphing on a coordinate graph
Inequalities and their Graphs Terms you see and need to know to graph inequalities correctly < less than Notice open circles > greater than
Inequalities and their Graphs ≤ less than or equal to ≥ greater than or equal to Notice colored in circles
Inequities in coordinate planematch each inequality with a graph. • > • < • > <
y x Objective - To graph linear inequalities in the coordinate plane. Number Line Coordinate Plane -4 -3 -2 -1 0 1 2 3 4 x = 3
y x Number Line Coordinate Plane -4 -3 -2 -1 0 1 2 3 4 y = -2
y x Boundary Line Test a Point False!
If y = mx + b, solid dashed shade up shade down
y x Boundary Line If y = mx + b, Dashed line Shade up
y x If y = mx + b, Solid line Shade up
y x If y = mx + b, Dashed line Shade down
y x If y = mx + b, Solid line Shade up
y x If y = mx + b, Dashed line Shade up
y x Write the inequality described by the graph below. -4 If y = mx + b, +3 Dashed line Shade Down
Determine whether the given point is a solution to the inequality -2x + 3y < 9. 1) (2, -3) Yes, (2,-3) is a solution. 2) (3, 5) No, (3,5) is not a solution.
Problem If you have less than $5.00 in nickels and dimes, find an inequality and sketch a graph to describe how many of each coin you have. Let n =# of nickels Let d =# of dimes 0.05 n + 0.10 d < 5.00 or 5 n + 10 d < 500
5n + 10d <500 n d d 50 60 50 40 30 20 10 0 0 100 0 n 0 10 20 30 40 50 60 70 80 90 100
Test Yourself • Click here to go through a multiple choice question set
On your own: • Review your notes. Rewrite and fortify them if needed. • Update your vocab list, if needed. • See worksheet handed out in class.