Age-Weighted Sound Levels and Community Annoyance Response Insights
This study by Michael A. Staiano (2006) explores the intricacies of how age and sound levels impact community annoyance responses. Through public opinion polling and ambient noise surveys, the research examines the annoyance response curve, weightings, and equal-loudness contours among 18-25 year-old males and females. The analysis includes aging-related hearing loss factors such as presbycusis and noise-induced conditions, revealing expected hearing loss trends in industrial contexts. The findings highlight the minor impact of aging on annoyance variation, presenting crucial insights into noise pollution's effects on different age groups.

Age-Weighted Sound Levels and Community Annoyance Response Insights
E N D
Presentation Transcript
Age-WEIGHTEDSOUND LEVELS Michael A. Staiano 10 July 2006 STAIANO ENGINEERING, INC.
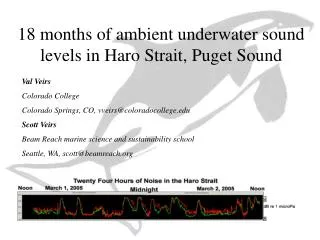
ANNOYANCE RESPONSE • Public opinion polling of community annoyance • Ambient noise survey of canvassed area
EQUAL-LOUDNESS CONTOURS Pure-tone response of 18-25-yr-old men and women
2006 U.S. POPULATION MEAN AGE: • Men and Women / All ages – 37 yr • Men and Women / ≥ 20 yr – 47 yr
HEARING LOSS • PRESBYCUSIS—aging • NOISE-INDUCED • occupational • sociacusis (every-day life) • NOSOACUSIS—disease, trauma, ototoxic drugs
EXPECTED HEARING LOSS 60-yr olds in industrial society but not exposed to workplace noise (OSHA 1983)
HEARING LOSS AGE-CORRECTION CURVES Hearing threshold re 20-yr-old males
NATURAL SOUNDS • Natural Sources: • Birds ≥ 2 kHz • Insects – cicadas ~1 kHz – crickets ~6 kHz • Ageing filters natural sounds relative to intruding noise?
CONCLUSION • A-weighting ageing error range: • 1 dB @ 40 yr • 2 dB @ 50 yr • 3 dB @ 60 yr • 4 dB @ 70 yr • Ageing relatively minor explanation for annoyance response variation