Download
1 / 1
10 likes | 114 Vues
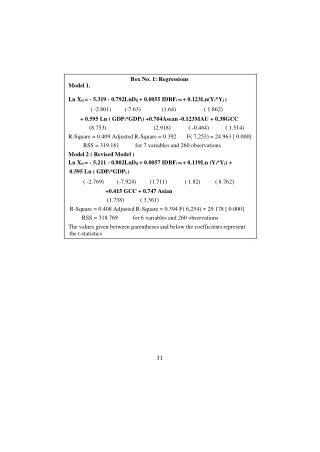
This study compares two regression models using economic variables to analyze relationships. Model 1 includes multiple factors such as GDP and regional trade agreements, while Model 2 modifies some coefficients from Model 1. The models are evaluated based on R-Square values and F-statistics. The t-statistics for coefficients are provided for further analysis.

E N D
Box No. 1: Regressions Model 1. Ln Xij = - 5.319 - 0.792LnDij + 0.0055 IDBFi 94 + 0.123Ln(Yi*Yj ) ( -2.801) (-7.63) (1.64) ( 1.862) + 0.595 Ln ( GDPi*GDPj) +0.704Asean -0.123MAU + 0.38GCC (8.753) (2.918) ( -0.464) ( 1.514) R-Square = 0.409 Adjusted R-Square = 0.392 F( 7,253) = 24.963 [ 0.000] RSS = 319.161 for 7 variables and 260 observations Model 2 ( Revised Model ) Ln Xij = - 5.211 - 0.802LnDij + 0.0057 IDBFi 94 + 0.119Ln (Yi*Yj) + 0.595 Ln ( GDPi*GDPj ) ( -2.769) (-7.924) (1.711) ( 1.82) ( 8.762) +0.415 GCC + 0.747 Asian (1.738) ( 3.361) R-Square = 0.408 Adjusted R-Square = 0.394 F( 6,254) = 29.178 [ 0.000] RSS = 318.769 for 6 variables and 260 observations The values given between parentheses and below the coefficients represent the t-statistics 31