Download
1 / 29
290 likes | 402 Vues
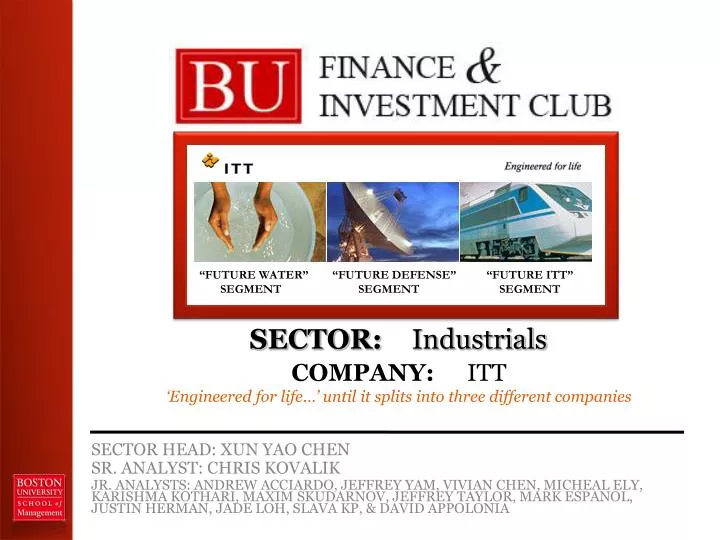
ITT Corporation, a key player in the Defense industry heavily reliant on U.S. government contracts, is undergoing a significant transformation. The company will split into three distinct entities, focusing on “Future Water,” “Future Defense,” and “Future ITT.” This strategic shift aims to unlock intrinsic value through improved market positioning and operational efficiency. With increased global water demand driven by population growth and sustainability concerns, ITT’s innovations in fluid management and analytics are poised to capitalize on market opportunities, including addressing aging infrastructure issues in the U.S.

E N D
SECTOR HEAD: XUN YAO CHEN SR. ANALYST: CHRIS KOVALIK JR. ANALYSTS: ANDREW ACCIARDO, JEFFREY YAM, VIVIAN CHEN, MICHEAL ELY, KARISHMA KOTHARI, MAXIM SKUDARNOV, JEFFREY TAYLOR, MARK ESPANOL, JUSTIN HERMAN, JADE LOH, SLAVA KP, & DAVID APPOLONIA “Future Water” “Future Defense” “Future ITT” Segment Segment Segment SECTOR:Industrials COMPANY: ITT ‘Engineered for life…’ until it splits into three different companies
Company Definition • ITT Corporation is primarily in the Defense industry • Communications and electronic devices. • 97% of Defense revenue from the US government. • It is significantly undervalued as a wholly defense company, • but an announcement earlier this year will change everything. • ITT’s Fluid Technology* business • Pumps, valves and measuring and control instruments for • fluids along the entire ‘water’ value chain. • ITT Motion & Flow Control ‘Engineering’ • Switches and valves for industrial and aerospace applications • and tubing systems, connectors, and brakes for various • markets in the transportation industry. Management has focused on improving ITT’s Fluid business with three 2010 acquisitions and the internal development and launch of “ITT Analytics,” announced March 28th, 2011.
NYSE: ITT Three Segments… into three “Future” Companies Source: Yahoo! Finance, Industrial Sector Research Source: Yahoo! Finance, Industrial Sector Research Source: Yahoo! Finance, Industrial Sector Research Source: Yahoo! Finance, Industrial Sector Research
Segment Products, Markets, & Geography "Future ITT" - 2011e Pro Forma Sales "Future Water" - 2011e Pro Forma Sales
Porter’sFive Forces Threat of New Entrants LOW Suppliers’ Power LOW Buyers’ PowerMODERATE Intensity of Competition MODERATE Threat of Substitutes MODERATE
Engineered to Grow“Future Water” Water & Wastewater Analytics Customers Industrial Process Residential & Commercial Water Environment Preservation Companies Pharmaceutical Laboratories HVAC Systems Water Treatment Plants Flood Clean-up Irrigation Services Irrigation, dewatering, etc. Products Pumps, valves, etc. for fluid systems. $ “Future Water”
“Future Water” targets nearly every area of water handling, control, treatment, and distribution
Why ITT? – Why Spin-offs?? Spin-off Provides Discount & Buyout Premium Opportunities Acid Test ($ in MM) “Future Defense” 2015 Projected EBIT… $707 “Future Water” 2015 Projected EBIT… $488 “Future ITT” 2015 Projected EBIT… $273 Total EBIT: $1,469 EBIT Multiple*: 10x Estimated TEV: $14,600 Less Net Debt: $333 Market Cap: $14,267 Upside: 30% • Large disconnect in pricing/multiples • Where its trading: • Defense multiple: <10x-10x P/E • Where it will trade: • Water multiple: 16x-20x P/E • Engineering multiple: 15x-17x P/E • Mergers & Acquisitions Season • Hoarding large sums of cash • Cheap debt • Slow recovery prompts external means of growth (Base Case) + 10 – 50% Intrinsic Value (Better Case) + 20 – 80% Intrinsic Value 40% of 2011-e revenue “Icing on the Cake” + 20 - 30% Buyout Premium (within two years) (Base Case with Buyout Premium) + 30 – 80% Total Upside
New Management Steve Loranger Chairman, President, CEO of ITT Chairman of Future Water Denise Ramos, ITT’s CFO David Melcher, President of ITT Defense & Information Solution Gretchen McClain, President of ITT Fluid & Motion Control CEO of Future ITT CEO of Future Defense CEO of Future Water
Increasing Population and Food Prices • 4,500 cubic kilometers of water are used every year, agriculture takes up to 70%. • By 2030, farmers will need 45% more water. • Over the next 40 years the irrigation industry will need a cumulative investment of one trillion dollars. Global population growth is “unsustainable” In the next 40 years, the world population is expected to grow by 40% Industrial consumption & renewable energy causing unforeseeable water externalities Water consumption has risen because of the drive toward renewable energy Global industrial use of water is predicted to almost double by 2030
Need for New Global Infrastructure • Increasing Global access to clean drinking water • The United Nation promised to reduce the proportion of the world population in 1990 without access to clean drinking water by 50% in 2015 Developing countries are reducing poverty levels • Over the past 10 years, malnourishment levels globally reduced to 15% and water coverage increased in both rural and urban environments • Estimated to exceed 1 billion in 2010 since the financial crisis • US is built upon a deteriorating infrastructure • Majority of US water mains are 50-90 years old, some over 100 years old • US uses roughly 7.77 trillion gallons of water per year • More than 20% of it, is lost due to leaks • In 2009, Washington issued $7 billion to water infrastructure
Engineered for BUY Recommendation *Ten year average adjusted beta of 1.00 Source: Yahoo! Finance Source: Yahoo! Finance
Valuation Comps – EV/EBITDA 40% P/S 30% DCF – 30% $75.91 +28.4% 1yr Target Price
Risks & Sensitivities • Given the negative trends seen in municipal spending- if 2011 – 2015 saw a 50% decrease in municipal spending in ITT’s products: • ITT Water revenues down by 16% • ITT total revenues down by 5.3% • Construction accounts for 23% of ITT Water Business. If ITT were to face a 50% decrease in construction spending, it would decrease: • ITT Water revenues by 11.5% • ITT total revenues by 3.8% • Plastic piping may attract more spending for infrastructure development • Funds for plastic pipes may be partially drawn from spending on ITT products • With about 50% of aggregate ITT’s revenue coming from the U.S. government management predicts an annual 2% decline in 2011, what if this is too optimistic? • If ITT faced 10% less contracts starting in 2011, ITT’s revenue would drop by 4.5%.
Recommendation Thank you for listening!
Questions? #2. Company Definition #16. Risks & Sensitivities #3. NYSE: ITT #17. Risks & Sensitivities #4. Segment Products, Markets, & Geography #18. Recommendation #5. Industry Snapshot #19. Questions? #6. Porter’s Five Forces #20. Engineered to Outlast “Future Defense” #7. Engineered to Grow “Future Water” #21. Engineered to Profit “Future ITT” #8. ITT & The Cycle of Water #22. Statistics #9. Why ITT? – Why Spin-offs?? #23. Capitalizing on Emerging Markets #10. New Management #24. Back-up Time Series #11. Increasing Population and Food Prices #25. Materials #12. Need for New Global Infrastructure #24. Properties #13. Engineered for BUY Recommendation #24. Asbestos Proceedings #14. Valuation #24. Revenue Recognition #15. Cross Sectional Analysis #24. Taxation
Engineered to Outlast“Future Defense” Customers Electronic Systems Geospatial Systems Information Systems Mission Systems Space Ground & Range Systems Communication Systems Force Protection Night Vision & Imaging Air Traffic Management ISR Systems Governmental Contracts 97% Commercial 3% $ “Future Defense”
Engineered to Profit“Future ITT” Aerospace Industrial Processing Customers Rail Marine & RV Automotive Friction Engineering Interconnect Solutions Technologies Industrials • Actuators • Pumps • Switches • Engine Coolers • Rate Controls • Diaphragm Seals • Hydrocarbon Processing • Mining • Pumps • Power Generation • Heat Exchangers • Brake Pads • Disc Clutches • Shock Absorbers • Fiber Optics • Connectors • Filters $ “Future ITT”
Capitalizing on Emerging Markets • 2010 Acquisition of Canberra Pumps in Brazil • 2010 Acquisition of Godwin Pumps in US • Growth of ITT Analytic’s Business • “The SI Analytics TitroLinetitrators from ITT Analytics offer a wide spectrum of capabilities for a variety of applications across the water and wastewater, environmental, food and beverage, pharmaceutical and chemical industries.”
Materials • Our business relies on third-party suppliers, contract manufacturing and commodity markets to secure raw materials, parts and components used in our products. In some instances we depend on a single source of supply, manufacturing or assembly or participate in commodity markets that may be subject to a limited number of suppliers. • All of our businesses require various raw materials, the availability and prices of which may fluctuate. Although some cost increases may be recovered through increased prices to customers, our operating results are exposed to such fluctuations. We attempt to control such costs through fixed-priced contracts with suppliers and various other programs, such as our global strategic sourcing initiative. There have been no raw materials shortages that have had a material adverse impact on our business as a whole. • For most of our products, we have existing alternate sources of supply, or such sources are readily available. We typically acquire materials and components through a combination of blanket and scheduled purchase orders to support our materials requirements for an average of four to eight weeks, with the exception of some specialty material. From time to time, we may experience price volatility or supply constraints for materials that are not available from multiple sources. Frequently, we are able to obtain scarce components for somewhat higher prices on the open market, which may have an impact on gross margin but does not disrupt production. We also acquire certain inventory in anticipation of supply constraints or enter into longer-term pricing commitments with vendors to improve the priority, price and availability of supply.
PROPERTIES • We have 575 locations, in 51 countries on 6 continents. These properties total 22 million square feet, of which 499 locations, or 12 million square feet are leased. We consider the many offices, plants, warehouses, and other properties that we own or lease to be in good condition and generally suitable for the purposes for which they are used. The following table shows the significant locations by segment and division.
Asbestos Proceedings • ITT, including its subsidiary Goulds Pumps, Inc. (Goulds), has been joined as a defendant with numerous other companies in product liability lawsuits alleging personal injury due to asbestos exposure. These claims allege that certain of our products sold prior to 1985 contained a part manufactured by a third party (e.g., a gasket) which contained asbestos. To the extent these third-party parts may have contained asbestos, it was encapsulated in the gasket (or other) material and was non-friable. In certain other cases, it is alleged that former ITT companies were distributors for other manufacturers’ products that may have contained asbestos. Frequently, the plaintiffs are unable to identify any ITT or Goulds product as a source of asbestos exposure. In addition, in a large majority of the claims against the Company, the plaintiffs are unable to demonstrate any injury. Many of those claims have been placed on inactive dockets. Our experience to date is that a substantial portion of resolved claims have been dismissed without payment by the Company. • We record a liability for pending asbestos claims and asbestos claims estimated to be filed over the next 10 years. While it is probable that we will incur additional costs for future claims to be filed against the Company, a liability for potential future claims beyond the next ten years is not reasonably estimable due to a number of factors. As of December 31, 2010, we recorded an undiscounted asbestos-related liability for pending claims and unasserted claims estimated to be filed over the next 10 years of $1,676, including expected legal fees, and an associated asset of $1,034, which represents estimated recoveries from insurers and other responsible parties, resulting in a net asbestos exposure of $642.
Revenue Recognition • Revenue is recognized when persuasive evidence of an arrangement exists, the price is fixed or determinable, collectability is reasonably assured and delivery has occurred or services have been rendered. For product sales, other than long-term construction-type contracts, we recognize revenue at the time title and risks and rewards of ownership pass, which is generally when products are shipped. Certain contracts with customers require delivery, installation, testing, certification or other acceptance provisions to be satisfied before revenue is recognized. We recognize revenue on product sales to channel partners, including resellers, distributors or value-added solution providers at the time of sale when the channel partners have economic substance apart from ITT and ITT has completed its obligations related to the sale. Service revenue is recognized as services are performed. For agreements that contain multiple deliverables, we recognize revenue for a delivered element when it has stand-alone value to the customer, there is objective and reliable evidence of fair value of the undelivered elements, and, in arrangements that include a general right of return relative to the delivered element, performance of the undelivered element is considered probable and substantially in the Company’s control. • The Defense segment and certain businesses within the Fluid segment enter into long-term construction-type sales contracts for which revenue is recognized under the percentage-of-completion method based upon units of delivery, percentage of costs incurred to total costs, or the completion of scheduled performance milestones. For units of delivery, revenues and profits are recognized based upon the ratio of actual units delivered to estimated total units to be delivered under the contract. Under the cost-to-total cost method, revenue is recognized based upon the ratio of costs incurred to estimated total costs at completion. Revenue is recognized under the milestone method, based upon accomplishing a clear deliverable output of contract performance with value to the customer. Revenue under cost-reimbursement contracts is recorded as costs are incurred and includes estimated earned fees or profits calculated on the basis of the relationship between costs incurred and total estimated costs. Revenue and profits on time-and-material type contracts are recognized based on billable rates times direct labor hours incurred plus material and other reimbursable costs incurred. The completed contract method is utilized when reasonable and reliable cost estimates for a project cannot be made. Amounts invoiced to customers in excess of revenue recognized are recorded as deferred revenue, until the revenue recognition criteria are satisfied, and is recorded as a component of accounts payable. Revenue that is earned and recognized in excess of amounts invoiced is recorded as a component of trade receivables. • During the performance of long-term sale contracts, estimated final contract prices and costs are periodically reviewed and revisions are made as required and recorded in earnings in the period in which they are determined. Additionally, the fees under certain contracts may be increased or decreased in accordance with cost or performance incentive provisions which measure actual performance against established targets or other criteria. Such incentive fee awards or penalties are included in revenue when there is sufficient information to reasonably assess anticipated contract performance. Our claims on contracts are recorded only if it is probable the claim will result in additional contract revenue and the amounts can be reliably estimated. Provisions for estimated losses, if any, on uncompleted long-term contracts, are made in the period in which such losses are determined and are recorded as a component of costs of revenue. • We record a reduction in revenue at the time of sale for estimated product returns, rebates and other allowances, based on historical experience and known trends. Additionally, accruals for estimated expenses related to warranties are made at the time products are sold or services are rendered and are recorded as a component of costs of revenue. These accruals are established using historical information on the nature, frequency and average cost of warranty claims and estimates of future costs. • Revenue is reported net of any required taxes collected from customers and remitted to government authorities, with the collected taxes recorded as current liabilities until remitted to the relevant government authority.