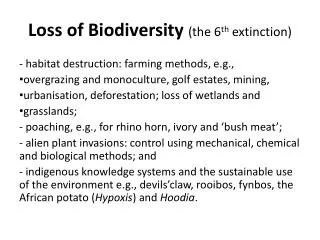
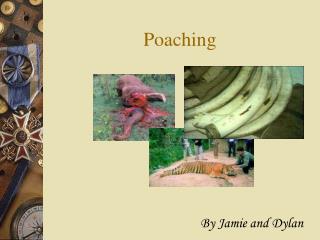
Download
1 / 33
330 likes | 335 Vues
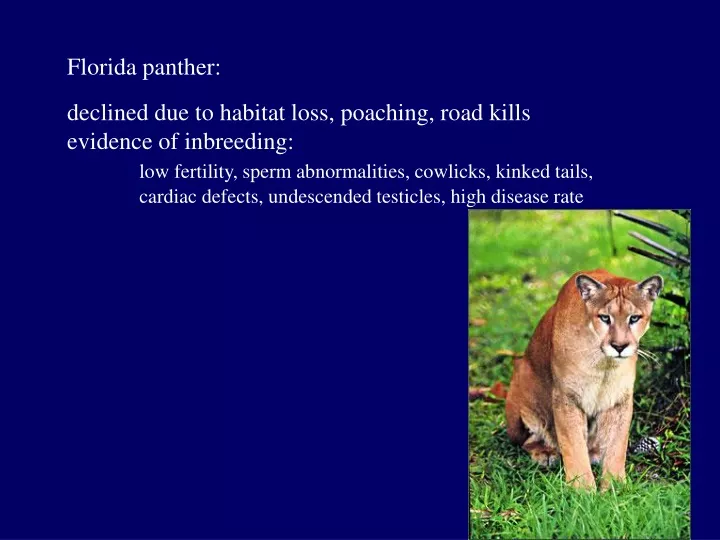
Florida panther: declined due to habitat loss, poaching, road kills evidence of inbreeding: low fertility, sperm abnormalities, cowlicks, kinked tails, cardiac defects, undescended testicles, high disease rate. Florida panther: Genetic studies indicated low variability: P H DNA H

E N D
Florida panther: declined due to habitat loss, poaching, road kills evidence of inbreeding: low fertility, sperm abnormalities, cowlicks, kinked tails, cardiac defects, undescended testicles, high disease rate
Florida panther: Genetic studies indicated low variability: P H DNA H Florida 4.9 1.8 10.4 Western US 9.9 4.3 29.7 Other felids 8-21 3-8 45.9 Found to have hybridized with S. American sub- species; introgressed animals with higher P
Florida panther: Outbred with sub-species from Texas - added 8 females in 1995 F1 hybrid kittens do not have cowlinks or kinked tails Texas genes are now 15-29% of total
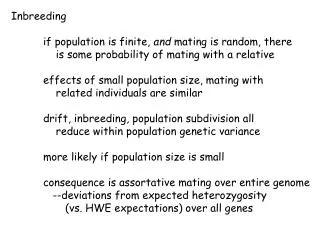
Variation: Variation is present • within individuals • among individuals within populations • among populations
metapopulations - networks of populations that have some degree of gene flow among geographically separate populations - regular extinction and recolonization events
Populations that are spatially isolated will tend to diverge genetically • each population is representative of the species, but may not contain all of the species’ variation • many populations may disappear before the species is endangered
Metapopulations endangered Glanville fritillary butterfly (Finland) – occupies meadows 1600 meadows, of which 320-524 were occupied in 1993-96 approx 200 extinctions and 114 colonizations per year Alan Barnes
Populations that are spatially isolated will tend to diverge genetically • how many subpopulations can we afford to lose? • which ones do we choose to save? how many? • how many do we have habitat for? • how different is different enough to warrant isolation/preservation?
Populations that are spatially isolated will tend to diverge genetically • how many subpopulations can we afford to lose? • which ones do we choose to save? how many? • how many do we have habitat for? • how different is different enough to warrant isolation/preservation? how well can we describe differences among populations?
Measurement of genetic differentiation among populations: genetic distance (D) • Quantitative measure of genetic divergence between two sequences, individuals, or taxa • Relative estimate of the time that has passed since two populations existed as a single, panmictic population
Three most commonly used distance measures • Nei’s genetic distance (Nei, 1972) • Cavalli-Sforza chord measure (Cavalli-Sforza and Edwards, 1967) • Reynolds, Weir, and Cockerham’s genetic distance (1983) • Nei’s assumes that differences arise due to mutation and genetic drift, C-S and RWC assume genetic drift only
Genetic distance Nei’s genetic distance surveyed over wide variety of taxa: geographic populations 0.024 + 0.003 subspecies 0.171 + 0.004 species 0.626 + 0.028 genera 1.340 + 0.064 Avise and Smith 1977, Davis 1983
Genetic distance (D) Dendrogram of genetic distances: (clustered using UPGMA, Unweighted Pair-Group Method with Arithmetic Mean: each new unit has a distance to the cluster = average of the distance from unit to each species in the cluster)
Lampsilis cardium (pocketbook mussel) Lampsilis ovata (pocketbook mussel)
Lampsilis cardium (pocketbook mussel) WV L. ovata IL L. cardium WV L. cardium VT L. “ovata” MO L. cardium WV L. fasciola 0.00 0.01 0.02 0.03 0.04 0.9 Nei’s genetic distance Lampsilis ovata (pocketbook mussel)
Habitat loss (mosquito control) • Spraying for mosquitoes added pesticides to food web • Reserve established; highway constructed through it • (to connect Kennedy Space Center w. Disney World) • Marsh drained • Last 7 males cross-bred with related sub-species – • unsuccessful • Last sparrow died in 1987 dusky seaside sparrow
Issues with genetic diversity among populations outbreeding depression/hybridization • local adaptation example: ibex extirpated from Czechoslovakia (Capra ibex ibex) - transplanted from Austria successfully (Capra ibex ibex) - then added bezoars (C. i. aegagrus) and Nubian ibex (C. i. nubiana) - fertile hybrids rutted in early fall instead of winter (as natives did) - kids of hybrids born in February, coldest month of year, entire population went extinct David Hall
Issues with genetic diversity among populations outbreeding depression/hybridization • local adaptation • co-adapted gene complexes
inbreeding depression outbreeding depression Reproductive success inbreeding random mating inter-breeding
Loss of fitness due to - Inbreeding: accumulation of homozygous recessives loss of superior heterozygotes Outbreeding: reduced fitness of F1 generation - disruption of local adaptation - epistatic interactions reduced fitness of F2 generation - breakup of co-adapted gene complexes More empirical studies on inbreeding than outbreeding….
Populations that are spatially isolated will tend to diverge genetically p = .8 q = .2 p = .5 q = .5 p = .7 q = .3 p = .55 q = .45 p = .5 q = .5
Genetic diversity among populations • Increases due to isolation, followed by • genetic drift • inbreeding • selection • local adaptation • Decreases due to gene flow (migration) as migrants move between populations, they homogenize allele frequencies among populations
Genetic diversity among populations • Increases due to isolation, followed by • genetic drift • inbreeding • selection • local adaptation • Decreases due to gene flow (migration) as migrants move between populations, they homogenize allele frequencies among populations • larger populations diverge slowly through drift – few migrants needed to counteract • small populations diverge rapidly through drift – more migrants needed to counteract
Changes in genetic diversity among populations m = proportion of population that migrates Nm = number of migrants randomly exchanged per generation Ne = 1,000, m = 0.01, Nm = 10 Ne = 100, m = 0.01, Nm = 1 approx 1 migrant/generation will maintain same alleles among populations (= qualitative similarity) but 10 migrants per generation may still permit significant differences in allelic frequencies ( = quantitative dissimilarity)
Changes in genetic diversity among populations m = proportion of population that migrates Nm = number of migrants randomly exchanged per generation Ne = 1,000, m = 0.01, Nm = 10 Ne = 100, m = 0.01, Nm = 1 “in the absence of natural selection, the amount of genetic divergence among demes is a function of the absolute number of migrants exchanged (Nm), not the proportion of exchange (m)” (Allendorf 1983)
Isolation by distance p = 0.65 q = 0.35 p = 0.75 q = 0.25 p = 0.55 q = 0.45 p=0.5 q=0.5 p = 0.5 q = 0.5 p = 0.4 q = 0.6
Isolation by distance Mussel ‘lures’ with glochidia
Genetic distance between populations Elliptio dilatata