Sampling the Ocean: Techniques, Biases, and Biological Patterns
390 likes | 510 Vues
This lecture discusses the methodologies for sampling the ocean, including ship-based and autonomous platforms, and the biases introduced by each method. It explores the significance of satellite ocean color imagery in identifying biogeographic provinces and analyzing spatial and temporal patterns in marine biology. The presentation covers advancements such as instrumented buoys and acoustics, highlighting the implications of ocean physiography and currents on biological distributions. It emphasizes the interplay of light, temperature, and ocean currents in shaping marine ecosystems.

Sampling the Ocean: Techniques, Biases, and Biological Patterns
E N D
Presentation Transcript
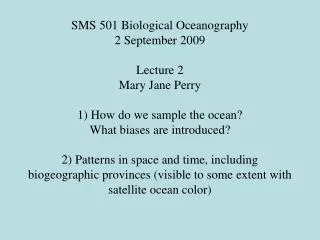
SMS 501 Biological Oceanography 2 September 2009Lecture 2Mary Jane Perry 1) How do we sample the ocean? What biases are introduced?2) Patterns in space and time, including biogeographic provinces (visible to some extent with satellite ocean color)
Ships – primary way to sample the ocean, last 100+ yrs Think about what biases are introduced by each type of sampling? Ship-board biology:– capture and count ’em (distribution & numbers)– capture and measure rates Photo credits: Dane Wojcicki
Down sides of ship based sampling - - -are Photo credits: Eric Rehm
Instrumented buoys & moorings came on line about 40 yrs ago – time series in one place. GoMOOS<gyre.umeoce.maine.edu/buoyhome.php> (now NEARACOOS <www.neracoos.org/>) non-ship biology is mostly acoustics & optics
GoMOOS Harpswell Sound (left) and Buoy E (right) Temp at 2 m, Mar-Sept 09 Temp at 2 m, 2001- 09 Temp at 50 m, 2001- 09 Chlorophyll at 2 m, Mar-Sept 09 Inter- annual
Ocean satellites came on line about 40 years ago – potential for large scale (to global) repeat coverage. August 2009 SST 3-yr average chlorophyll from ocean color http://weather.unisys.com/surface/sst.gif
Autonomous platforms (floats, gliders, AUVs) have been increasing in importance as a way to study the ocean. Think of them as a network; movable; require proxy measurements. ARGO - http://www.argo.ucsd.edu/index.html
Phytoplankton spring bloom in Labrador Sea – studied 3+ yr with bio-optical ARGO-type float. Boss et al. 2008 L&O.
OOI – Combination of assets What are advantages & disadvantages of each type of sampling ? http://www.oceanleadership.org/programs-and-partnerships/ocean-observing/
2) Patternsocean physiography and currentsspatial and temporal scales – light, temp, etc. (how will these affect biology & biological patterns?) Scales: – ocean is 70% of earth’s surface (µm to planet) – sec, hr, d, yr, decadal, climate, geological (~Byr)biogeographic provinces and patterns seen with satellite ocean color imagery (unless cited, figures are from Steward’s book on Physical Oceanographyhttp://oceanworld.tamu.edu/resources/ocng_textbook/contents.html
Ocean Basins from space, with 3 main basins: Pacific (181.3), Atlantic (106.6), Indian (74.1) x 106 km2<http://www.ngdc.noaa.gov/mgg/fliers/97mgg03.html>
How does graphic representation affect your understanding? Depth-to-width ratio important for ocean currents - vertical velocities are much less than horizontal velocities. (Steward, Chap.3) Cross-section of S. Atlantic along 25°S showing continental shelf off S.America, seamount near 35°W, mid-Atlantic Ridge near 14°W, Walvis Ridge near 6°E, and narrow continental shelf off S.Africa. Upper: Vertical exaggeration of 180:1. Lower: Vertical exaggeration of 30:1. If shown with true aspect ratio, the plot would be the thickness of the line at the sea surface in the lower plot.
http://www.physicalgeography.net/fundamentals/chapter10.html Note depth scale. Wide vs. narrow continental shelves (east vs. west coast of US) –– implications for primary productivity and nutrient regeneration; movement of pelagic fish (deep to shallow for feeding)
Surface currents areconstrained by continents (eastern and western ‘boundary currents’); driven by wind; characterized by subtropical gyres; eddies; fastWhat are implication for material exchanges? heat? pollutants? genes? Check out: http://oceancurrents.rsmas.miami.edu/index.html Pidwirny, M. (2006). "Surface and Subsurface Ocean Currents: Ocean Current Map". Fundamentals of Physical Geography, 2nd Edition. Date Viewed. http://www.physicalgeography.net/fundamentals/8q_1.htm
Surface currents are relatively fast;there is exchange between ocean basins http://www.afsc.noaa.gov/REFM/docs/oscurs/get_to_know.htm http://www.dailymail.co.uk/news/article-464768/Thousands-rubber-ducks-land-British-shores-15-year-journey.html
Water mass formation in Atlanticcold, dense water formed at poles .Implication for global circulation of freshening due to ice melt ?What’s the implication for learning if you look at a 2-D picture for a 3-D process? http://homepage.mac.com/uriarte/carbon13.html
Net transport of subsurface currentswarm surface and blue deep cold; driven by density (T & S); ‘conveyer belt’ – transport of heat and nutrients; slow (loop ~1,000 yr.Directions of flow vary at different depths Pidwirny, M. (2006). "Surface and Subsurface Ocean Currents". Fundamentals of Physical Geography, 2nd Edition. Date Viewed. http://www.physicalgeography.net/fundamentals/8q.html
2) Patternsocean physiography and currentsspatial and temporal scales – light, temp, etc. (how will these affect biology & biological patterns?)Scales: – ocean is 70% of earth’s surface (µm to planet) – sec, hr, d, yr, decadal, climate, geological (~Byr)biogeographic provinces and patterns seen with satellite ocean color imagery
Radiation (kilowatt hour/ m2/d) Jan (month) Dec Northern hemisphere, annual solar radiation –as a function of month (time) and latitude (space). These changes drive heat flux, temperature, water column stability, timing of blooms, nutrient exchange, etc. http://www.fao.org/DOCREP/003/X6541E/X6541E03.htm
Solar heating –> temperature increases seasonally in mid to high latitudes (example data from BATS).More heating at the surface, but also to ~ 150 m. Radiation Jan Dec
Is pattern in solar radiation related to pattern in global SST?What else could affect global pattern? Radiation Jan Dec August 2009 SST
Radiation (kilowatt hour/ m2/d) Jan (month) Dec How would seasonal pattern in solar radiation affect prediction for phytoplankton photosynthesis? Would production also increase with temp ?
But what about nutrients resupply?Increased stratification reduces nutrient injection from below pycnoclione. T data from BATS Pycnocline Nutrient data from BATS (nitrate and phosphate) www.bios.edu/Labs/co2lab/research/BATS.html
SSH and SST anomalies in Pacific Jan 1996 – Oct 1999 http://topex-www.jpl.nasa.gov/gallery/tiffs/videos/sshsst-globalocean.mov
Annual mean surface salinity http://aquarius.nasa.gov/education-salinity.html(Annette deCharon’s website) Where does evaporation exceed precipitation? What’s the consequence?
Density effects: (5ºC ~ 1 unit salinity) Not salty but cold, water is dense Salty but warm, water is buoyant Evaporation minus precipitation => stratifies gyres.
2) Patternsocean physiography and currentsspatial and temporal scales – light, temp, etc. (how will these affect biology & biological patterns?) Scales: – ocean is 70% of earth’s surface (µm to planet) – sec, hr, d, yr, decadal, climate, geological (~Byr)biogeographic provinces and patterns seen with satellite ocean color imagery
Biogeographical ProvinceFrom A Dictionary of Zoology | Date: 1999A biological subdivision of the Earth's surface, usually on the basis of taxonomic rather than ecological criteria, and embracing both faunal and floral characteristics. The hierarchical status of such a unit, and the total number of such units, varies from one authority to another. Is that a useful concept? Maybe, for ecosystem based management, documenting effects of climate change. Book by Longhurst: Ecological Geography of the Sea What are the underlying mechanisms? biotic and abiotic (some discussed earlier this afternoon)
Wooodd-Walker etal. 2002, MEPS 236:189 http://www.windows.ucar.edu/tour/link=/earth/polar/arctic_marine_life.html&edu=elem&file=new/
Ocean color Atlantic Ocean Autumn 2002 through 2006 http://oceancolor.gsfc.nasa.gov/cgi/climatologies.pl/A20022642006354.L3m_SCAU_CHLO_9.png?TYP=machl
Autumn 2002 through 2006 http://oceancolor.gsfc.nasa.gov/cgi/climatologies.pl/A20022642006354.L3m_SCAU_CHLO_9.png?TYP=machl
Human use of the ocean is often inconsistent with ecological patterns – understanding biogeographical provinces, what creates/maintains them and how to assess them is critical for success of MSP. (see also Science (2006) 313: 617 – includes Jim Wilson)
MODIS http://www.physics.miami.edu/~chris/envr_optics.html
Gordon empirical algorithm Reflectance Ratio (blue/green) Chlorophyll concentration (log scale)
SeaWiFS imagery: Autumn 2002 through 2006 http://oceancolor.gsfc.nasa.gov/cgi/climatologies.pl/A20022642006354.L3m_SCAU_CHLO_9.png?TYP=machl