Download
1 / 1
10 likes | 161 Vues
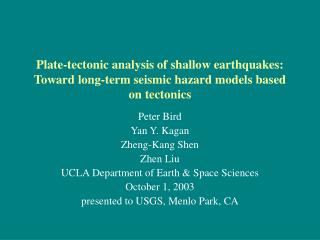
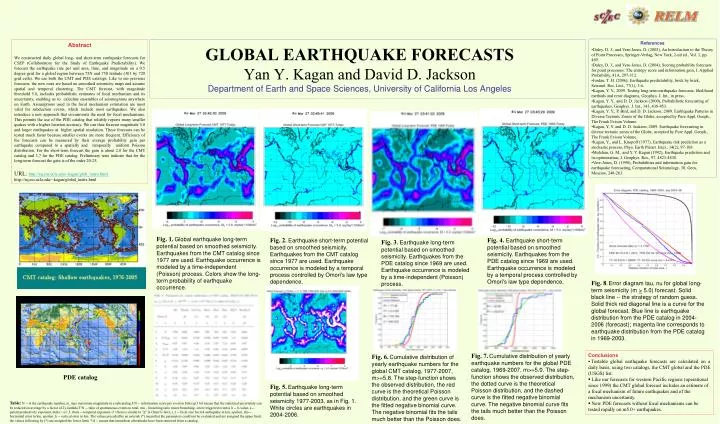
GLOBAL EARTHQUAKE FORECASTS Yan Y. Kagan and David D. Jackson Department of Earth and Space Sciences, University of California Los Angeles . References Daley, D. J., and Vere-Jones, D. (2003), An Introduction to the Theory of Point Processes, Springer-Verlag, New York, 2-nd ed., Vol. 1, pp. 469.

E N D
GLOBAL EARTHQUAKE FORECASTSYan Y. Kagan and David D. JacksonDepartment of Earth and Space Sciences, University of California Los Angeles • References • Daley, D. J., and Vere-Jones, D. (2003), An Introduction to the Theory of Point Processes, Springer-Verlag, New York, 2-nd ed., Vol. 1, pp. 469. • Daley, D. J., and Vere-Jones, D. (2004), Scoring probability forecasts for point processes: The entropy score and information gain, J. Applied Probability, 41A, 297-312. • Jordan, T. H. (2006), Earthquake predictability, brick by brick, • Seismol. Res. Lett., 77(1), 3-6. • Kagan, Y. Y., 2009. Testing long-term earthquake forecasts: likelihood methods and error diagrams, Geophys. J. Int., in press. • Kagan, Y. Y., and D. D. Jackson (2000), Probabilistic forecasting of earthquakes, Geophys. J. Int., 143, 438-453. • Kagan, Y. Y., P. Bird, and D. D. Jackson, 2009. Earthquake Patterns in Diverse Tectonic Zones of the Globe, accepted by Pure Appl. Geoph., The Frank Evison Volume. • Kagan, Y. Y. and D. D. Jackson, 2009. Earthquake forecasting in diverse tectonic zones of the Globe, accepted by Pure Appl. Geoph., The Frank Evison Volume. • Kagan, Y., and L. Knopoff (1977), Earthquake risk prediction as a stochastic process, Phys. Earth Planet. Inter., 14(2), 97-108. • Molchan, G. M., and Y. Y. Kagan (1992), Earthquake prediction and its optimization, J. Geophys. Res., 97, 4823-4838. • Vere-Jones, D. (1998), Probabilities and information gain for earthquake forecasting, Computational Seismology, 30, Geos, Moscow, 248-263. AbstractWe constructed daily global long- and short-term earthquake forecasts for CSEP (Collaboratory for the Study of Earthquake Predictability). We forecast the earthquake rate per unit area, time, and magnitude on a 0.5 degree grid for a global region between 75N and 75S latitude (301 by 720 grid cells). We use both the CMT and PDE catalogs. Like to our previous forecasts, the new ones are based on smoothed seismicity maps and assume spatial and temporal clustering. The CMT forecast, with magnitude threshold 5.8, includes probabilistic estimates of focal mechanism and its uncertainty, enabling us to calculate ensembles of seismograms anywhere on Earth. Assumptions used in the focal mechanism estimation are most valid for subduction events, which include most earthquakes. We also introduce a new approach that circumvents the need for focal mechanisms. This permits the use of the PDE catalog that reliably reports many smaller quakes with a higher location accuracy. We can thus forecast magnitude 5.0 and larger earthquakes at higher spatial resolution. These forecasts can be tested much faster because smaller events are more frequent. Efficiency of the forecasts can be measured by their average probability gain per earthquake compared to a spatially and temporally uniform Poisson distribution. For the short-term forecast the gain is about 2.0 for the CMT catalog and 3.7 for the PDE catalog. Preliminary tests indicate that for the long-term forecast the gain is of the order 20-25. URL: http://eq.ess.ucla.edu/~kagan/glob_index.html http://eq.ess.ucla.edu/~kagan/global_index.html Fig. 1.Global earthquake long-term potential based on smoothed seismicity. Earthquakes from the CMT catalog since 1977 are used. Earthquake occurrence is modeled by a time-independent (Poisson) process. Colors show the long-term probability of earthquake occurrence. Fig. 2.Earthquake short-term potential based on smoothed seismicity. Earthquakes from the CMT catalog since 1977 are used. Earthquake occurrence is modeled by a temporal process controlled by Omori's law type dependence. Fig. 4. Earthquake short-term potential based on smoothed seismicity. Earthquakes from the PDE catalog since 1969 are used. Earthquake occurrence is modeled by a temporal process controlled by Omori's law type dependence. Fig. 3. Earthquake long-term potential based on smoothed seismicity. Earthquakes from the PDE catalog since 1969 are used. Earthquake occurrence is modeled by a time-independent (Poisson) process. Fig. 8.Error diagram tau, nu for global long-term seismicity (m > 5.0) forecast. Solid black line -- the strategy of random guess. Solid thick red diagonal line is a curve for the global forecast. Blue line is earthquake distribution from the PDE catalog in 2004-2006 (forecast); magenta line corresponds to earthquake distribution from the PDE catalog in 1969-2003. • Conclusions • Testable global earthquake forecasts are calculated on a daily basis, using two catalogs, the CMT global and the PDE (USGS) list. • Like our forecasts for western Pacific regions (operational since 1999) the CMT global forecast includes an estimate of a focal mechanism of future earthquakes and of the mechanism uncertainty. • New PDE forecasts without focal mechanisms can be tested rapidly on m5.0+ earthquakes. Fig. 7.Cumulative distribution of yearly earthquake numbers for the global PDE catalog, 1969-2007, m>=5.0. The step-function shows the observed distribution, the dotted curve is the theoretical Poisson distribution, and the dashed curve is the fitted negative binomial curve. The negative binomial curve fits the tails much better than the Poisson does. Fig. 6.Cumulative distribution of yearly earthquake numbers for the global CMT catalog, 1977-2007, m>=5.8. The step-function shows the observed distribution, the red curve is the theoretical Poisson distribution, and the green curve is the fitted negative binomial curve. The negative binomial fits the tails much better than the Poisson does. PDE catalog Fig. 5.Earthquake long-term potential based on smoothed seismicity 1977-2003, as in Fig. 1. White circles are earthquakes in 2004-2006. Table:N -- is the earthquake number, m_max maximum magnitude in a subcatalog, I/N -- information score per event in bits/eq (1 bit means that the statistical uncertainty can be reduced on average by a factor of 2), lambda T/N -- ratio of spontaneous events to total, mu – branching ratio (more branching - more triggered events), b -- b-value, a -- parent productivity exponent, delta = a/1.5, theta -- temporal exponent, (1+theta is similar to "p" in Omori's law), s_r -- focal size for m4 earthquake in km, epsilon_rho -- horizontal error in km, epsilon_h -- vertical error in km. The values preceded by an asterisk (*) mean that the parameters could not be evaluated and are assigned the upper limit, the values following by (*) are assigned the lower limit. */d -- means that immediate aftershocks have been removed from a catalog.