Download
1 / 4
40 likes | 148 Vues
Explore land cover changes in the Chesapeake Bay watershed from 1984 to 2006, emphasizing tree canopy loss, urban expansion, and agricultural decline based on U.S. government data.

E N D
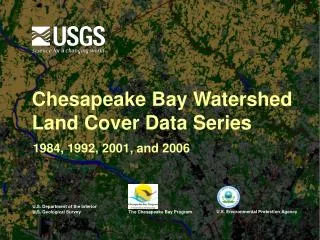
Chesapeake Bay Watershed Land Cover Data Series 1984, 1992, 2001, and 2006 U.S. Department of the Interior U.S. Environmental Protection Agency U.S. Geological Survey The Chesapeake Bay Program
Open water Low intensity urban Medium, High intensity urban Barren Tree canopy Shrub/ grass Agriculture/ open space Wetlands Montgomery County, Maryland 1984 - 2006 1984 2001 2006 1992
Open water Low intensity urban Medium, High intensity urban Barren Tree canopy Shrub/ grass Agriculture/ open space Wetlands York, Pennsylvania 1984 - 2006 1984 2001 2006 1992
Land Change: 1984 – 1992 – 2001 - 2006 Tree canopy decreased in every period, from 62.6% of the watershed land area in 1984 to 61.5% in 2006 (- 439,080 acres). Tree canopy decreased at the highest rate (-37,403 acres per year) between 2001 and 2006. Urban area increased 14% (355,146 acres) between 1984 and 2006. The annual rate of increase between 1984 and 1992 was twice the annual rate of increase of the latter two periods. The extent of agricultural and open space land decreased the most between 1984 and 1992 (- 8,700 acres per year). Agricultural and open space land decreased at much lower rates during the latter two periods (-2,110 and – 941 acres per year).