Download
1 / 22
220 likes | 396 Vues
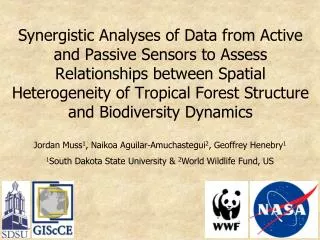
Naikoa Aguilar-Amuchastegui. Forest Carbon Scientist REDD+ Forest and Climate Initiative. http://www.conservation.org/learn/climate/solutions/mitigation/Pages/climate_REDD.aspx. Introduction to Geographic Information Systems (GIS). EVS 485.

E N D
Naikoa Aguilar-Amuchastegui • Forest Carbon Scientist • REDD+ • Forest and Climate Initiative http://www.conservation.org/learn/climate/solutions/mitigation/Pages/climate_REDD.aspx
Introduction to Geographic Information Systems (GIS) EVS 485
Representing Cartographic ObjectsRaster and Vector Data Structures Real World Raster Representation Vector Representation
Things are represented by Cartographic Objects Points Lines Areas Individuals Populations Locations Limits Paths Streams Transects Land Cover Ecoregion Watershed Reef • Do rivers or roads (linear features) have width? • Do point features have area? Scale Class
Maps (layers) • Databases (by Theme) • Mappable things (features) • Attributes
GIS Allows Manipulation • Editing • Analysis • Computer interface • Decision making • Problem study • Modeling
Data Analysis – The Heart of GISProblem:Identifying Potential Sites for Industry 2 1 3 5 4
Spatial Modeling Allocation of conservation incentives in Nebraska? Land use/cover NDVI Elevation Slope Soil Texture Percent silt Percent sand Percent clay Depth To water table To bedrock
Raster and Vector Data Roads, Rivers, locations – Vector Points, lines and Polygons Digital Elevation Model (DEM) – Raster Cells (pixels)
So we measure the EMR that comes (emitted or reflected) from an object of interest and try to figure out its meaning!!! • Actually we do it all the time!!!! • We just need mindset training.
“ Today, GIS is to mapping what word processing is to writing” James Merchant Ph.D