Hierarchical Cluster Analysis of WGA-Enriched Proteins in Giardia Cysts and Trophozoites
10 likes | 85 Vues
This study utilized hierarchical cluster analysis to compare the abundance of WGA-enriched proteins expressed by Giardia trophozoites and cysts. The heat map obtained clearly distinguishes between the two stages based on protein expression profiles, with color coding aiding in the identification of stage-specific proteins. The reproducibility of abundant proteins was high, whereas low abundance proteins showed variability between experimental runs. Hierarchical clustering normalized protein abundance and highlighted stage-specific clusters. Despite potential variability in mass spectrometry runs, the heat map reveals significant differences between cysts and trophozoites.

Hierarchical Cluster Analysis of WGA-Enriched Proteins in Giardia Cysts and Trophozoites
E N D
Presentation Transcript
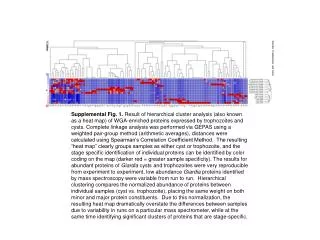
Supplemental Fig. 1. Result of hierarchical cluster analysis (also known as a heat map) of WGA-enriched proteins expressed by trophozoites and cysts. Complete linkage analysis was performed via GEPAS using a weighted pair-group method (arithmetic averages), distances were calculated using Spearman’s Correlation Coefficient Method. The resulting “heat map” clearly groups samples as either cyst or trophozoite, and the stage specific identification of individual proteins can be identified by color coding on the map (darker red = greater sample specificity). The results for abundant proteins of Giardia cysts and trophozoites were very reproducible from experiment to experiment, low abundance Giardia proteins identified by mass spectroscopy were variable from run to run. Hierarchical clustering compares the normalized abundance of proteins between individual samples (cyst vs. trophozoite), placing the same weight on both minor and major protein constituents. Due to this normalization, the resulting heat map dramatically overstate the differences between samples due to variability in runs on a particular mass spectrometer, while at the same time identifying significant clusters of proteins that are stage-specific.