Cell Sorting
-. +. LASER. Cell Sorting. -. +. LASER. Cell Sorting. Data Presentation. Zhang at al, Blood 2003, 102: 3938-46

Cell Sorting
E N D
Presentation Transcript
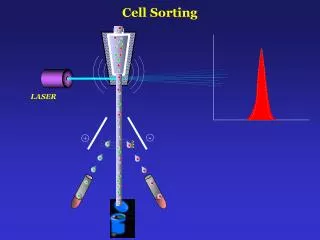
- + LASER Cell Sorting
- + LASER Cell Sorting
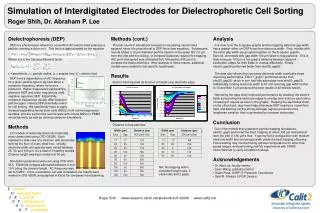
Data Presentation Zhang at al, Blood 2003, 102: 3938-46 Flow cytometry analysis of mouse fetal liver cells. Mouse fetal liver cells were freshly isolated from E14.5 embryos and double labeled with a FITC-conjugated anti-CD71 monoclonal antibody (mAb) and a PE-conjugated anti-TER119 mAb. Dead cells (propidium iodide–positive) and debris (low forward scatter) were excluded from analysis. The top left panel illustrates a density plot of all viable fetal liver cells; axes indicate relative logarithmic fluorescence units for PE (x-axis) and FITC (y-axis). Regions R1 to R5 are defined by characteristic staining pattern of cells, including CD71medTER119low, CD71highTER119low, CD71highTER119high, CD71medTER119high, and CD71lowTER119high, respectively. R1 to R5 cells were sorted by FACS and their purity was reanalyzed, as shown in the remaining 5 panels.
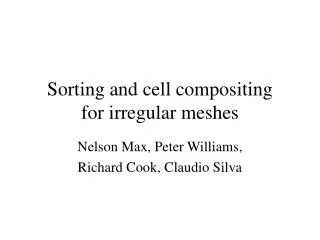
Data Presentation Petit et al, Cytometry 1995, 19: 304-312 FIG. 1. Multiparameter flow cytometric analysis of mouse testis cell suspension. Cells were stained with 0.2 pM NAO … and then 10 pg PI was added. Two parameter flow cytometric analysis: NAO vs. DNA area. Photomicrographs of cells sorted from the 0.5, 1.0, and 2.0 DNA index regions.