Aggregate Demand
Aggregate Demand. Up to this point in macroeconomics we have looked at the basic concepts of RGDP, unemployment and inflation from a definitional point of view. This is good because we have to have a solid understanding of these ideas.


Aggregate Demand
E N D
Presentation Transcript
Up to this point in macroeconomics we have looked at the basic concepts of RGDP, unemployment and inflation from a definitional point of view. This is good because we have to have a solid understanding of these ideas. Next we build a model of the economy that we will use to help us understand why RGDP, unemployment, inflation and other related concepts change. If we can understand why changes happen, then perhaps performance of these macroeconomic variables can be managed. The model we will work with is called the model of Aggregate Demand (AD) and Aggregate Supply (AS). For a while our focus will be on Ad and AS separately, then we will bring the two parts together. Our model is about AD and AS interacting to “produce” the results in the economy. But, we look at the mechanics of each part first.
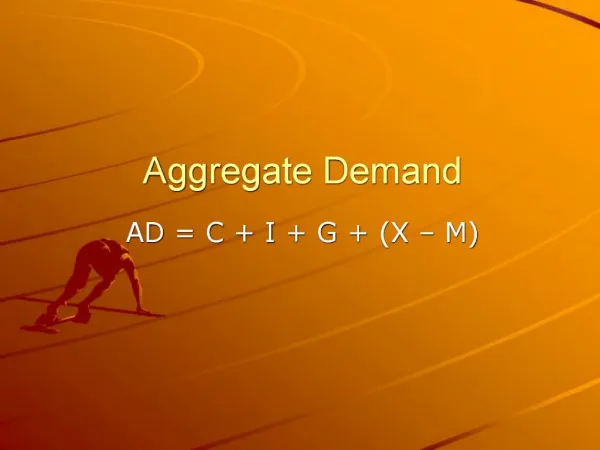
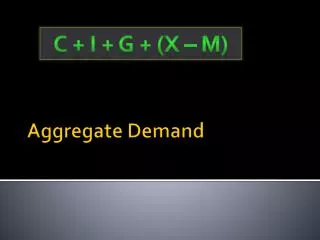
Aggregate Demand Aggregate demand refers to the amount of real output, RGDP, that buyers collectively desire to purchase at each possible price level. Remember from our earlier work that the buyers referred to here are in 1 of 4 groups: Households undertaking consumption (C), Businesses undertaking investment (I), Governments undertaking government purchases (G), and The rest of the world undertaking net exports (Xn)(the buying of goods made in US, net of any items purchased here but made in other countries).
AD in a graph Price level AD RGDP
Downward slope of AD curve Note the downward slope of the AD curve as you look at the curve from left to right. The relationship between the price level and the amount of RGDP desired is said to be inverse. Now we want to give this idea economic meaning. There are 3 reasons for the downward sloping AD curve. 1) Real balance or real wealth effect – as the price level rises the purchasing power of people’s assets such as savings accounts or bonds declines. Folks are poorer and thus causes households to reduce C and save a bit so they can afford essentials in the future.
Downward slope of AD curve 2) Interest rate effect – (we see this idea more later) as the price level rises you and I demand more money (the gallon of milk we buy for 2.00 goes up to, say about two fifty, and so we need more money to make our transactions). With a given money supply, a higher money demand makes the interest rate rise and thus consumption and investment fall. 3) Foreign purchases effect – as the price level domestically rises (assuming the rate does not change in other countries), it becomes increasingly difficult for foreigners to buy our goods and we want more of their goods and thus net exports fall.
Shift AD curve The AD line can also shift left or right. What things make the AD line shift (we call these things demand shifters or determinants of AD)? Remember we said Households undertake consumption (C), Businesses undertake investment (I), Governments undertake government purchases (G), and The rest of the world undertakes net exports (Xn)(the buying of goods made in US, net of any items purchased here but made in other countries). Anything that changes these components (except for a price level change) will shift the AD curve.
Consumption The greater the wealth, w, the greater will consumption be and AD shifts right. expc, or consumer expectations about the future, has an influence on C. The more confident about the future consumers are, the more will consumption spending be now and AD shifts right. The higher the level of household debt, HD, the more consumption can occur and AD shifts to the right. If taxesc (= taxes on households) rise then consumption will fall. In fact if taxesc go up by X the C falls by MPC times X and the AD curve shifts to the left. (The reverse of each factor follows the same basic pattern.)
Investment I = I(amo, bt, tc, expb, i), where I = investment plans, amo = Acquisition, maintenance, and operating costs, bt = Business taxes, tc = technological change, expb= expectations business have about the future, and i= the interest rate. If amo goes up I goes down and AD shifts left. If bt goes up I goes down and AD shifts left. If tc goes up I goes up and AD shifts right. The higher the business expectation about the future the more investment will be today and AD shifts right. A higher interest rate means it is more costly to invest, so less will happen and AD will shift to the left.
Government Spending and Net Exports G = G(politics), so government spending is largely determined in the political arena. An increase in G shifts AD right. Xn= Xn(for, e) where Xn= net exports and for = the health of foreign economies and e = relative strength of dollar against other currencies. If foreign economies get better then Xn rises and AD shifts right. If the dollar appreciates more exports from US are more difficult for foreigners and it is easier for us to make imports. Xn falls and the AD shifts to the left.
AD shifting and the multiplier Price level AD1 AD2 RGDP
AD shifting and the multiplier On the previous slide I have AD1, AD2 and an AD curve between the 2. When we look back at all the items that can shift the AD, if we get a shift from one of these items then the first shift is from AD1 to the dashed line. Recall that the multiplier concept was about an initial change in spending is transformed into a larger change in RGDP. Here this means after the initial change due to a demand shifter change, the multiplier will kick in and shift the AD curve even more.