Understanding Photon Fluctuation in Photography: Noise vs. Detail
In photography, the rate of incoming light can fluctuate, leading to variable brightness and noise. This fluctuation is determined by the Poisson distribution, impacting the quality of images captured. With an increasing number of pixels on a sensor, each pixel receives less light, potentially increasing noise and reducing image quality. This guide explores how sensor size and pixel density influence noise levels and image detail, debunking the "Megapixel Myth." Learn how to balance pixel count and sensor size for optimal photography results.


Understanding Photon Fluctuation in Photography: Noise vs. Detail
E N D
Presentation Transcript
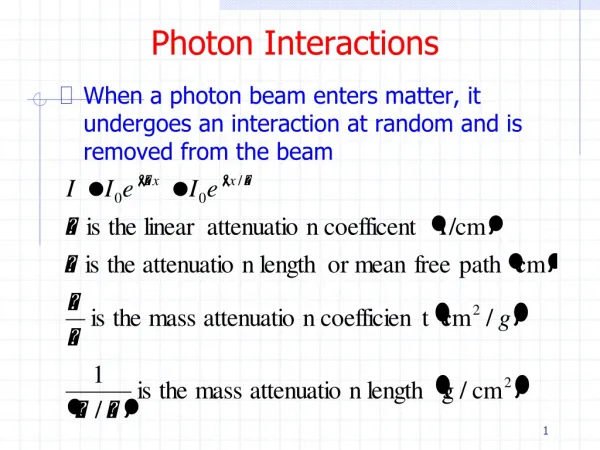
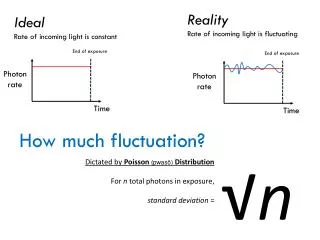
Real life Rate of incoming light is fluctuating Ideal Rate of incoming light is constant End of exposure End of exposure Photon rate Photon rate Time Time How much fluctuation? √n Dictated by Poisson (pwasõ) Distribution For n total photons in exposure, standard deviation =
√n, so what? Variable brightness = noise! Photons collected = n + √n If n = 10,000 photons, Photons collected = 10,000 + √10,000 = 10,000 + 100 photons 10,000 photons 9,900 photons 10,100 photons 9,950 photons Noise monsterOne of the photographer’s worst enemies
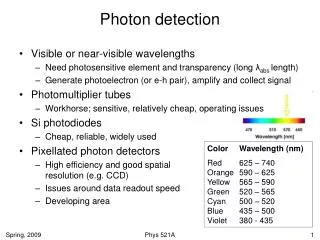
Canon A570IS 7.1 Megapixels 1/2.5” sensor 5.76 x 4.29mm (24.7mm2) Density: 3.48 μm2/pixel Proportion of Photon Fluctuation (√(n)/n) Photons
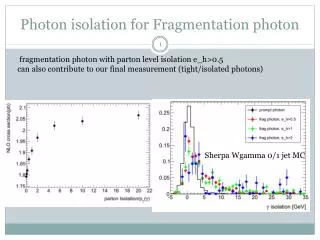
ISO100 ISO200 ISO400 Canon A570IS 7.1 Megapixels 1/2.5” sensor 5.74 x 4.3mm (24.7mm2) Density: 3.48 μm2/pixel 1600 800 400 200 100 ISO800 ISO1600 images: dcresource.com
ISO100 ISO200 ISO400 Fuji F30 6.1 Megapixels 1/1.7” sensor 7.7 x 5.77mm (44.4mm2) Density: 7.27 μm2/pixel 1600 800 400 200 100 ISO800 ISO1600 images: dcresource.com
ISO100 ISO200 ISO400 Canon 30D 8.2 Megapixels APS-C sensor 22.5 x 15mm (337.5mm2) Density: 41.16 μm2/pixel 1600 800 200 400 ISO800 ISO1600 100 images: dcresource.com
F30 30D A570IS 6.1 Megapixels 7.7 x 5.77mm (44.4mm2) Density: 7.27 μm2/pixel 8.2 Megapixels 22.5 x 15mm (337.5mm2) Density: 41.16 μm2/pixel 7.1 Megapixels 5.76 x 4.29mm (24.7mm2) Density: 3.48 μm2/pixel F30 30D A570IS
Making matters worse, circuitry must occupy some space between each photowell – the more photowells, the more space circuitry takes up.
Summary More pixels, smaller sensor => less light per pixel => more noise Less pixels, bigger sensor => more light per pixels => less noise In theory, the biggest sensor with the least pixels will give us the best image, in terms of noise. A 1-pixel sensor would be ideal. With 1 pixel, we’d have low noise but no detail. Many pixels => High detail, high noise Few pixels => Low detail, low noise The “Megapixel Myth”: Detail vs. Noise
Megapixels: Detail vs. Noise How many pixels do we need?: Facebook profile picture: 4x6 studio print at 300dpi: 5x7 studio print at 300dpi Standard VGA TV: 1080p HDTV: 1280x1024 19” LCD monitor: 8.5x11in, 300dpi magazine spread: 8x10 inkjetprint at 200dpi: 10x14in, 150dpi full-page spread in Daily Cal: Giant 20x30in poster print at 150dpi: 0.03 MP 2.16 MP 3.15 MP 0.35 MP 2.07 MP 1.31 MP 8.42 MP 3.20 MP 3.15 MP 13.5 MP • If you only look at pictures on the computer, 2-3MP • If you make non-poster-size prints (4x6, 5x7, 8x10), 3-4MP • More pixels beyond this don’t add detail, and contribute to greater noise